
 English
  Português
  Español
 Dr. Luis E. Leone
Definition . The electrocardiogram (ECG) is the time-function recording of the electrical currents produced by each contraction of the heart. Among the procedures to study cardiac functioning, the ECG provides invaluable information without risk, as it is a non-invasive method of very modest cost and can be obtained by the specialist, the clinician, the nurse or the student.
The method makes it possible to obtain information on the heart rate and myocardial status (presence or absence of ischemia or necrosis), detect dilatations or hypertrophy of the cardiac chambers, and study in detail the different arrhythmias that may occur.
Cell depolarization and repolarization . When the resting myocardial cell is excited, ion flux occurs through its membrane, which by modifying the existing ionic concentration ratios, alter the transmembrane potential difference.
Initially, sodium flows from the external environment to the intracellular environment, then potassium passes in the opposite direction, and finally an active ionic transport, the sodium and potassium pump, promotes the return to the previous electrolyte relationships.
During the period that elapses from the initiation of the excitation to the return to the resting condition, the transmembrane potential difference is quite variable.
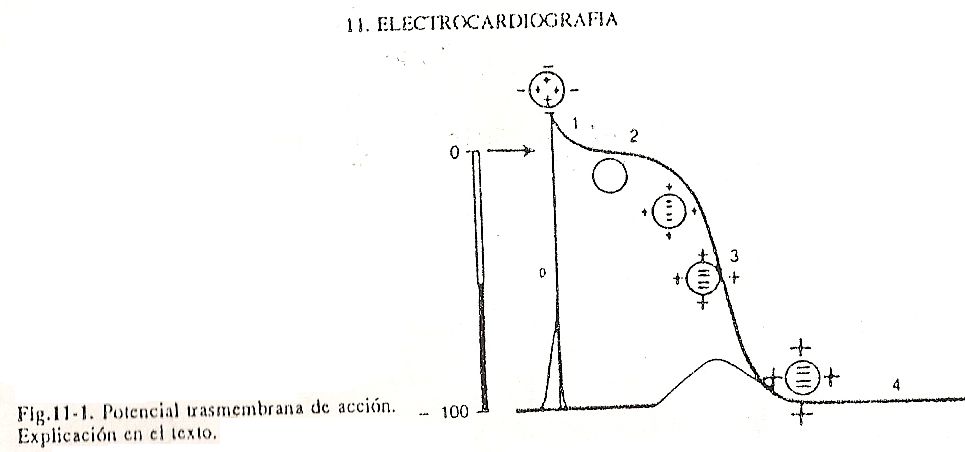
The record of these variations is the curve called transmembrane action potential, which can, for educational purposes, be divided into five phases. The initial phase, or phase 0 of depolarization, depends on the rapid entry of sodium into the cell following an electrochemical gradient. After the excitation rises sharply, the membrane conductance for this ion increases. The consequent increase in the amount of cations in the intracellular medium determines a decrease in the transmembrane potential difference; there is even a reversal of potential and the internal environment becomes more positive than the external. (Fig. 11-1).
In the myocardial fibers of contraction, a positive deflection with a different ascension speed and magnitude is registered in the various cell groups of the specific conduction system.
Cell repolarization begins once the maximum level of depolarization has been reached. This is a phenomenon that invariably follows depolarization, although it is slower and more easily alterable due to the effect of numerous factors.
Phase 1 registers the tendency to equalize intracellular and extracellular power levels and is due to the decrease in sodium input and the increase in potassium output. Phase 2, in plateau, is the consequence of an equilibrium between declining sodium input and increasing potassium output. In turn, at this time the slow calcium channels would begin to act. Phase 3 is related to an increase in potassium output, which becomes the main transmembrane ionic movement. The loss of cations from the intracellular medium, and the consequent gain from the extracellular medium, increases the transmembrane potential difference. This leads the curve towards values similar to those found at the beginning of depolarization;
At this time there are more sodium ions inside the cell and more potassium ions outside the cell than there were before depolarization. Phase 4 depends on the action of the enzyme system known as the sodium and potassium pump. There is an exit of sodium and an entry of potassium, with a return to the electrolyte relationships existing before excitation. This movement is active and depends on an energy-producing enzyme system.
This system is phospholipoprotein in nature, it is located at the cell membrane level, and the energy to be used comes from the hydrolysis of ATP. This phenomenon requires the presence of sodium and potassium and the ATPase system (sodium-potassium dependent), and releases highly energetic phosphate.
According to the characteristics of phase 4, myocardial cells are divided into automatic and non-automatic. Automatic cells are those that have the property of spontaneously depolarizing, while non-automatic cells are those that depolarize only when they are excited. Non-automatic cells have a constant transmembrane potential during phase 4 around -90 mV, and they hardly depolarize when they are excited by the propagation of activation.
Action potential
During phase 4, the automatic cells spontaneously undergo variations in their transmembrane potential from the maximum diastolic potential levels, approaching the limit of excitability, this level is around -70mV, variable for each cell group. Depolarization then occurs, corresponding to phase 0. This gradual decrease in transmembrane potential is called spontaneous diastolic depolarization, which is the basis for the most widely accepted theory currently on the automatism of the myocardial fiber. These cells are located mainly at the level of nodes: the sinus node, the atrioventricular node and later in the specific conduction system. But basically it is in the sinus node,
The driving system . The sinus node is located at the level of the mouth of the superior vena cava in the right atrium, which presents, in that place, cell nucleations with slopes of spontaneous diastolic depolarization whose value at rest is the closest to the excitation potential .
In this way, it is the sinus node that commands the automaticity of the heart, allowing stimuli to be discharged with a frequency between 80 and 100 times per minute; These stimuli are subsequently conducted towards the atrioventricular node and the branches of the bundle of His, causing excitation and contraction of the lower parts of the heart, in this case, both ventricles.
 The atrioventricular node is a serial component of the conduction system that interposes a delay between atrial and ventricular contractions. This is postulated to allow maximum atrial emptying and to delay ventricular contraction until the effective sweet spot within the cycle is reached. The bundle of His carries the impulse from the atrioventricular node, of which it is a continuation, to its right and left branches. The right branch is single, but the left gives rise to a small, early septal branch, before bifurcating into its divisions: anterior and posterior. Terminal arborizations ending in the myocardium and endocardial are designated the Purkinje system. Fig. 11.2 Activation dipole
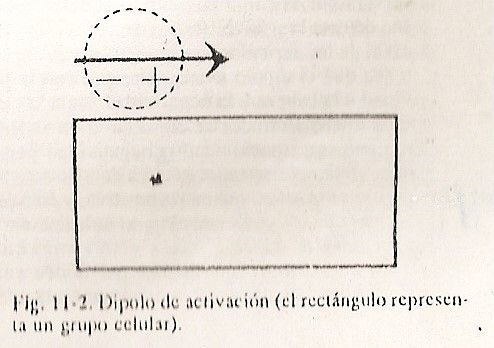
Despite the slow passage of the impulse through the atrioventricular node, the route in the rest of the conductive system is very fast. Electrical activation is a dynamic phenomenon with the progression of the stimulus. The neighboring points will turn negative successively, always in relation to the immediately higher positives. This phenomenon can be simplified to the greatest possible extent by imagining depolarization as a wave that has a positive peak charge followed immediately by a negative one, leaving behind a trace of negativity (Fig. 11-2).
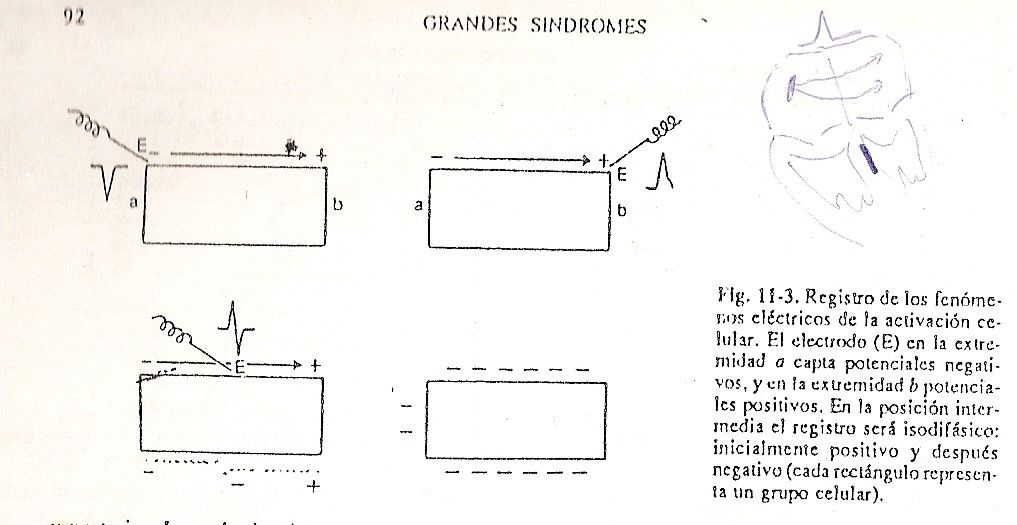 These two points, closely juxtaposed and with opposite charges that go on the crest of the wave, are called a dipole. In other words, the concept of a dipole would be: Fig. 11-3 an electric charge that is advancing with its positivity at the head and its negativity at the tail. Therefore, as the excitation occurs, the stimuli, as they descend, produce negativity in the sectors from which they are moving away, and positivity in the regions where that dipole is approaching. This is checked by placing a microelectrode at the level of the atrium and another at the level of the ventricle. In this way, as the stimulation is reproduced, it will be observed that the positive discharge is the one that will be detected at the level of the ventricles, and that negative charges will be captured at the level of the atria, in other words, the dipole always advances with positivity at the head and negativity at the tail. If these microelectrodes are connected to a recording system, this positivity or negativity will allow a positive wave to be inscribed in those sectors towards which the dipole is approaching, and a negative wave to be inscribed in those sectors from which it is moving away (Fig. 11-3).
In the intermediate sectors through which the dipole passes, a diphasic wave will be found, that is, with an initial positivity and a subsequent negativity, the same.
Electrical phenomena of the atria . Atrial depolarization. The first region to depolarize is the Keith and Flack nodule, which becomes negative relative to other unexcited portions. The wave of negativity advances through the sinoatrial conduction system, spreading tangentially to the wall and causing simultaneous activation of the endocardium and epicardium of the atria.
Due to the location of the sinus node in the right atrium, this is the first to be activated, followed by the interatrial septum and the left atrium. The left atrium receives the electrical impulse from the sinus node through the Bachmann fascicles.
The last region activated in the right atrium is located inferiorly between the tricuspid valve and the inferior vena cava, while the last activated in the left atrial process are located in the posteroinferior region, at the level of the mouth of the inferior pulmonary veins. . The electrocardiographic recording of atrial activation is called the P wave.
Atrial repolarization . Once the activation of the atria is finished, the recovery phenomenon begins, in which the first regions to become positive are the portions near the sinus node. The repolarization wave propagates parallel to the atrial wall, reaching its two surfaces simultaneously.
Atrial repolarization does not appear on the ECG as it is involved in the ventricular depolarization process, and therefore atrial repolarization will be invisible on the ECG.
Electrical phenomena of the ventricles . Ventricular depolarization. The stimulus, progressing rapidly through the last branches of the Purkinje wall, activates the myocardial fibers of the ventricles after a short latency time. Despite the fact that the electrical depolarization phenomenon is continuous, there is an evident delay in the propagation of the stimulus from the specific tissue to the basal myocardium.
The first portion to depolarize is located approximately in the middle portion of the left face of the interventricular septum, according to the works of Sodi et al., That septal region will be the first to lose its positivity, becoming negative in relation to other portions of the ventricles. not yet depolarized. This phenomenon can be represented by a resulting vector, the sum of a large number of very small electrical forces that initiate the ventricular depolarization process.
When studied on the body surface, the vector that arises early in the electrical field of the heart can be designated as vector I or septal vector, and it has electrocardiographic expression despite its small magnitude because it is the dominant force at this initial moment of the heart. depolarization (Fig. 11-4, A and B).
The orientation of the initial vector will depend on the spatial position of the intraventricular septum, which in turn depends on the rotations of the heart.
During septal depolarization, the stimulus propagates through the endocardial surface of the two ventricles where the fibers of the Purkinje system favor a very rapid and almost simultaneous activation of half or two-thirds of the thickness of the ventricular free walls.
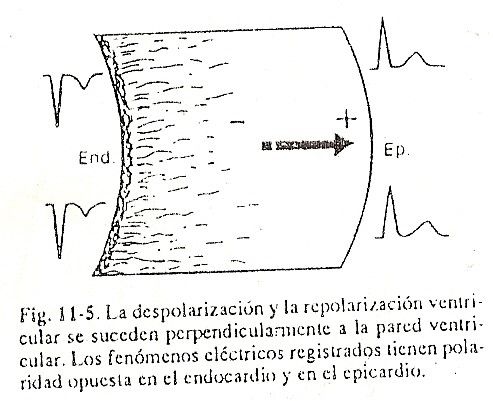
The depolarized internal surface behaves negatively in relation to the external one, whose depolarization begins, that is, again in this area we find a dipole that advances from the endocardium to the epicardium, conferring negativity to the endocardium and positivity to the epicardium (Fig. 11-5 ).
Contrary to the atria, the progression of the electrical stimulus in the ventricles is perpendicular to the wall, going from the endocardium to the epicardium.
In normal adult hearts, the potentials generated by the right ventricle are of low magnitude due to the small thickness of its walls, while those of the left ventricle are of much greater amplitude; After initial depolarization of the middle portion of the septum, the lower septal region and the free wall of the right ventricle are depolarized, slightly increasing the power of the forward and right-directed electrical forces.
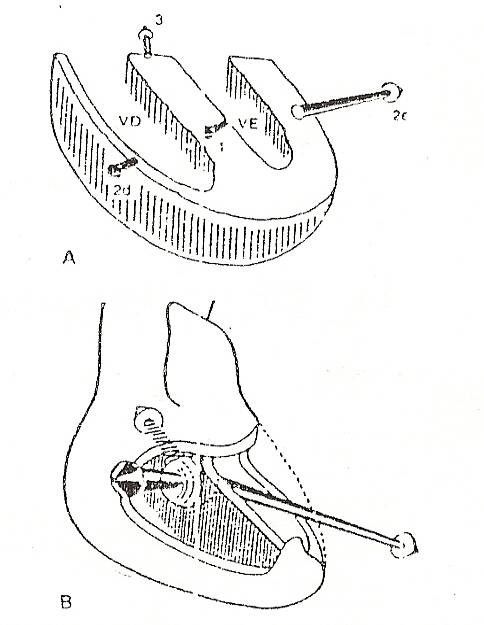 Fig. 11-4 RV vectors Fig. 11-4 RV vectors |
An electrical force resulting from the sum of the two vectors II right and II left predominates, that is, vector II, which as a consequence of the predominance of the potentials of the left ventricle is oriented backwards, to the left and downwards, pointing towards the ventricle dominant. Later the stimuli reach the upper and lower portions of the ventricles and the interventricular septum, which are the last to be activated; the mean direction of the depolarization process of these regions, represented by vector III or basal vector, points upwards, to the right and backwards.
Therefore, to better understand the electrical phenomena of the heart on the body surface, it is possible to synthesize the complex process of ventricular depolarization –which would correspond to an infinite number of vectors- in the three main vectors indicated: vector I or septal vector, the vector II or vector of the free wall of the left ventricle, and vector III or basal vector.
In daily practice, it is common to consider the resulting mean vector, or AQRS vector, as the one that synthesizes all the electrical phenomena manifested during ventricular depolarization. This AQRS vector determines or summarizes ventricular depolarization forces. Such forces determined by this vector can have different locations.
Later, it will be seen how to determine this vector resulting from all ventricular depolarization, which in different individuals can vary in orientation according to different anatomical, physiological or structural alterations (eg, hypertrophy or dilation of the cardiac chambers. ).
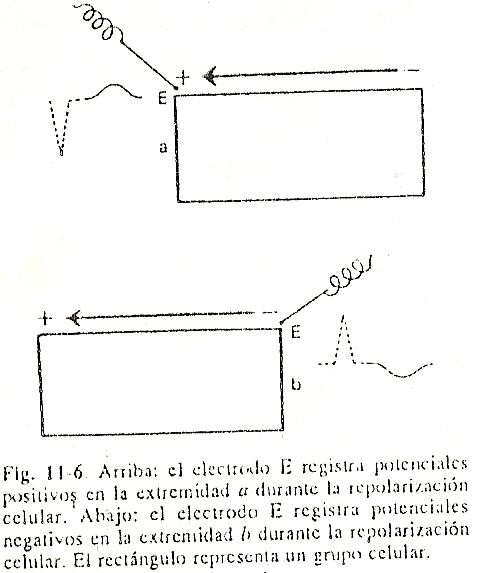
Repolarización ventricular. After the QRS complex has been inscribed, the entire myocardial mass is depolarized and shows negative signs. Since there are no appreciable differences in potential for a certain time, an almost isoelectric line called the ST segment will be observed. Immediately afterwards, the ventricular repolarization phenomenon begins, in which the cells gain positive charges. The potential difference that begins to establish between the already repolarized zones and the still negative ones causes a slow, rounded deflection to be registered called the T wave. Contrary to what happens in the atria, the recovery of the ventricles usually inscribes a wave with polarity equal to that of the QRS complex, that is, if the complex is positive, the T wave will also be inscribed above the isoelectric line (Fig. 11-6).
Ventricular repolarization, which should take place from the endocardium to the epicardium, is reversed due to the debatable action of several factors that would delay the recovery of the subendocardial portions. These factors include the pressure of the intracavitary blood on the endocardium, the lower temperature of the latter in relation to the epicardium, and even the better irrigation of the subepicardial portions. (Fig. 11-7).
There would then be a wave of positivity that would slowly advance from the epicardium towards the endocardium. If we look carefully, despite positive potentials Above.
Below negative potentials that the process is directed from the epicardium towards the endocardium, the representative vector of ventricular repolarization remains pointing towards the external regions, where the initial positivities are, and advances towards the endocardium as if in reverse.
In this way, if we place an explorer electrode to the left of the precordium, it would see the tip of the vector throughout the process, registering a positive deflection. The T wave is morphologically asymmetric, with a slow ascending branch and a steeper descending one.
 This symmetry could be attributed to the initial slowness of the subepicardial recovery phenomena, the newly activated area, followed by more rapidity in the depolarized subendocardial portions. It is possible to highlight that, although there is an infinite number of electrical forces, here it is also valid to consider, in the same way as with the AQRS vector, a resultant force represented by a repolarization vector that is oriented from the endocardium towards the epicardium, from top to bottom and from right to left, due to the predominance of left muscle mass; this vector, called AT, summarizes the entire ventricular repolarization process.
 Vector analysis of the electrical activity of the heart. The electrical phenomena that develop during myocardial activation propagate through the conductive media that surround the heart and determine, on the body surface, potential differences that can be recorded by electrocardiographs. An exploratory electrode placed on the thorax, at the level of the cardiac apex, records the variations in potential already mentioned in normal individuals. The first positive wave represents the depolarization of the atria and is called the P wave. The electrical phenomenon manifested by rapid deflections down and up the isoelectric line corresponds to the complex process of ventricular depolarization and is called, as a whole, complex QRS. A T wave is then inscribed, corresponding to ventricular repolarization. The U wave is also observed,
It could be assumed, by the dipole theory, that there are four representative vectors of the different phases of the cardiac cycle: the depolarization and repolarization vectors of the atria and the depolarization and repolarization vectors of the ventricles; however, atrial repolarization, which occurs largely in conjunction with the dominant phenomenon of ventricular depolarization, has almost no electrocardiographic expression under normal conditions.
Therefore, it is sufficient to subdivide the electrical activity of the heart into three main vectors:
1. The vector AP, which represents the space, magnitude, direction and direction of atrial activation.
2. The AQRS vector, which synthesizes ventricular depolarization, projection in the frontal plane.
3. The AT vector, which in frontal projection represents the magnitude and orientation in space of ventricular repolarization.
The ECG allows us to study the electrical forces of the heart located both in the frontal plane and in the horizontal plane.
The derivations of the frontal plane . The derivations on the surface of the body can be infinite, that is why it has been necessary to establish a convention, so that the obtained records could be compared. Different types of leads have been determined: the first lead, or DI, which studies the potential difference between the left arm and the right arm; the second lead, or DII, which measures the potential difference between the left leg and the right arm; and the third lead, or DIII, which measures the potential difference between the left leg and the left arm.
Bipolar limb leads are also called classic or standard leads. So the classic or standard leads are DI, DII, and DIII.
In order to be able to study in more depth the different cardiac areas, new leads, called unipolar, are developed. Unipolar leads are those that connect the scanned point of the heart with the electrical center of the heart. In the frontal plane, then, leads DI, DII and DIII, aVR, aVL, and aVF, of which the last three are unipolar leads, are recorded and studied.
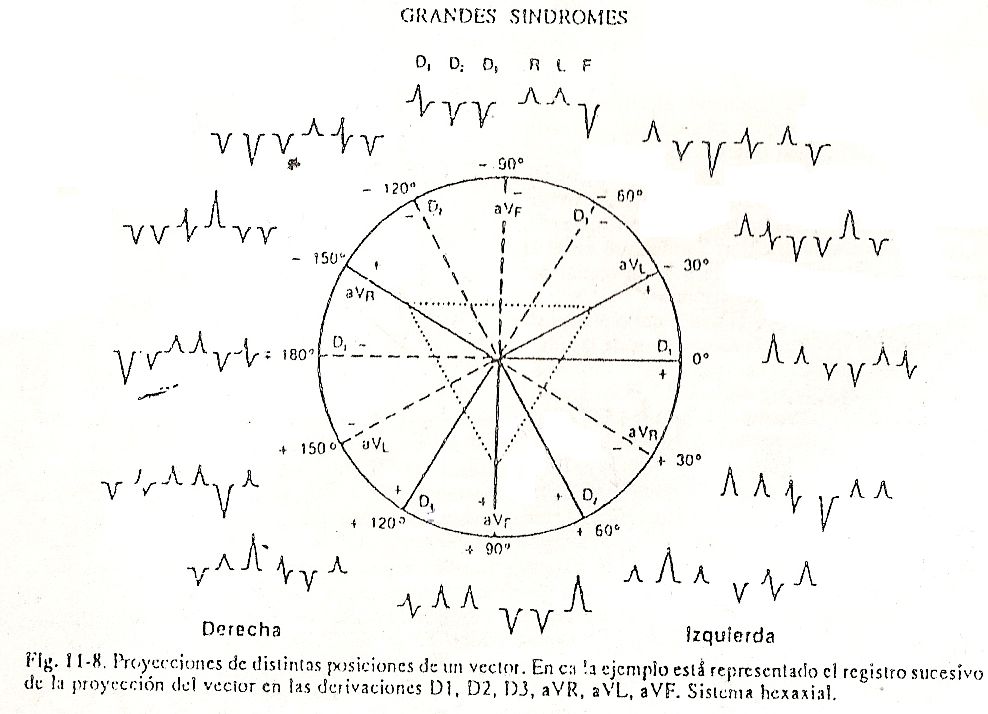
Determination of electric vectors . To locate a vector, a graduated circumference is used (fig. 11-8) in which the transversal diameter separates the two fields: one of positive values, located below and where the angular values vary from 0º to + 180º, and another of negative values, in the upper semicircle that vary from 0º to -180º. If the other leads are traced in said circumference divided by a transversal line (representing DI, that is, the union between the right arm and the left arm), we would have DII, which measures the potential difference between the left leg and the left arm. right, and DIII, which measures the difference between the left leg and the left arm.
Subsequently, in said circumference the unipolar leads are drawn: aVR which measures the difference between the right arm and the electrical center of the heart; aVL, between the left arm and the electrical center of the heart; and aVF, between the left leg and the electrical center of the heart.
In this way, the six derivations of the frontal plane would be represented (fig. 11-8). Each of the lines drawn must be prolonged, crossing at point 0 and continuing until it cuts the circumference again. In this way the so-called hexaxial system is constructed. Through this system it is possible to determine the AQRS vector or vector resulting from ventricular depolarization.
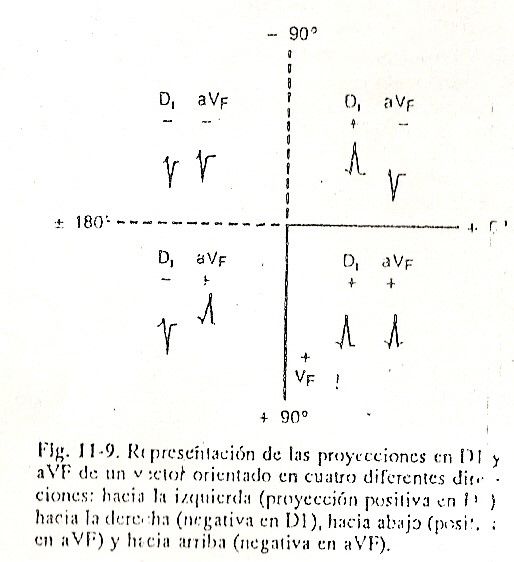
To establish the electrical axis in a practical way, a method is used that facilitates the projection of a vector in the frontal plane and that consists of observing the areas of the studied phenomenon -in this case the QRS complex- in the DI and aVF leads. The DI derivation allows to know the orientation to the left if the projection is positive, or to the right if the projection is negative; aVF, being vertical, determines the orientation downwards, positive projection, or upwards, negative projection.
If the areas have a positive predominance in these two leads, the vector will be located between 0º and + 90º. When the projection is positive in DI and negative in aVF, the vector will be located between 0º and -90º, and if the projection is negative in DI, the vector will be to the right. If aVF is positive it will be between + 90º and + 180º and if it is negative between -90º and -180º (fig.11-9)
 A more approximate location of the same vector can be obtained, from 30º to 30º, if the projection in other leads is considered at this time. It should be noted that in the circle of the projections of the frontal plane, all derivations are positive in one half (a hemicircle is equal to 180º) and negative in the other. For example, the DIII lead is positive between + 30º and -150º, in the clockwise direction. In the same sense, aVL is positive between -120º and + 60º; the line that marks the sign change is the perpendicular to the derivation considered; thus, a vector located between 0º and + 90º would be situated between 0º and + 30º when, in addition, its positive projections in DI and aVF were negative in DIII. The vector would be between + 30º and +60 when the projections were positive in DI and aVL. Finally, when in DIII they appear positive and in aVL negative, they would indicate a situation between + 60º and + 90º. The same method can be used for the other quadrants.
The heart is a three-dimensional organ and therefore cardiac vectors have a spatial orientation; as is known, two planes are enough to orient a vector in space. Thus, if the projections of a vector in the frontal and horizontal planes are known, that vector can be located in space.
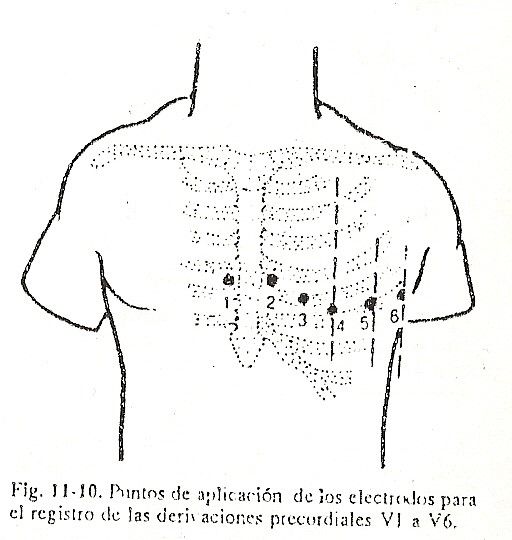
In addition to the six leads already described, six other unipolar leads are recorded in daily practice, which have been designated V1, V2, V3, V4, V5, and V6 (Fig. 11-10). The location of these six leads is as follows:
V1: at the intersection of the right fourth intercostal space with the right edge of the sternum;
V2: at the intersection of the fourth left intercostal space with the left edge of the sternum;
V3: in the middle of the distance between V2 and V4;
V4: at the intersection of the fifth left intercostal space with the midclavicular line;
V5: at the same height as V4 at the intersection with the anterior axillary line;
V6: to the same line as V4 and V5 at the intersection with the mid-axillary line.
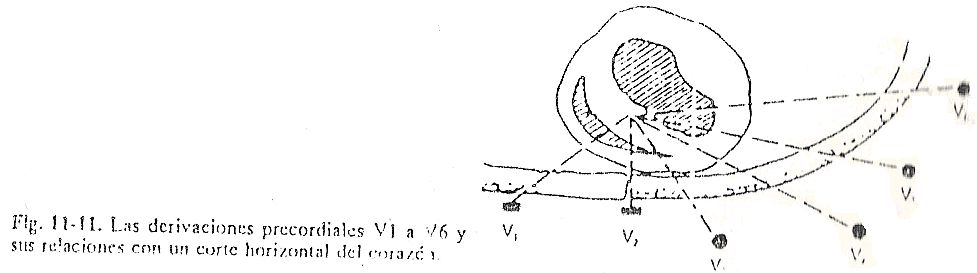
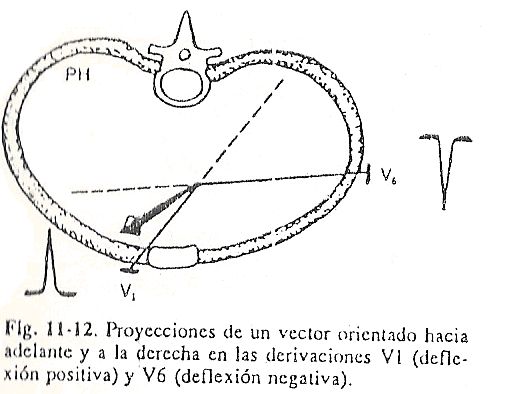
 All of them explore the electrical phenomenon from the anterior aspect of the thorax and are called precordial. Precordial leads are considered sagittal plane leads. Thus, in a thoracic segment comprising the fourth and fifth ribs and the fourth and fifth intercostal spaces, the precordial lead lines would be found (Fig. 11-11 and 11-12).
The electrical center of the heart is the point where the cardiac vectors are apparently applied; it is also called the center of apparent origin of vectors. Considering a horizontal section of the thorax, the electrical center is deflected forward and to the left; therefore it is projected on the lateral wall more anteriorly than at the point corresponding to V6, and on the anterior wall approximately at the level of V2, which is to the left of the midline. It is for this reason that to know if the AQRS vectors are oriented forward or backward, it is enough to calculate the polarity of the deflections in the derivation of V2.
If the QRS complexes are predominantly positive in V2, their respective vectors are directed forward; when on the contrary they are predominantly negative, the vectors are turned backwards; and if they are isodiphasic, with an algebraic sum equal to 0 in V2, the orientation is perpendicular to this line of deviation and therefore the vector is located in the frontal plane without deviating neither forwards nor backwards.
The electrocardiographic record
Coordinates of the recording paper . In electrocardiographic tracing, time is measured by vertical lines separated from each other by a constant interval that corresponds to a preset value. The voltage, in turn, is related to horizontal lines, also separated from each other by a fixed interval, which corresponds to a certain voltage value. In this way, a system of abscissa and ordinate is constructed that forms a grid on the paper. On common direct record papers, the grid indicates the following:
Each line (both vertical and horizontal) is one millimeter apart from another, thus forming small squares one millimeter on a side.
Between each group of five squares there is a thicker line that delimits larger squares, 0.5 centimeters on each side.
 In daily practice a standard speed is printed by pulling the paper. This speed is 25mm / sec.
 The waves are the deflections P, QRS (which is a complex), T and U. The space intervals are: a) the PR interval, which goes from the beginning of the P wave to the initiation of the QRS complex, and which comprises by both the P wave and the PQ segment, and b) the QT interval, which goes from the beginning of the QRS complex to the initiation of the T wave, and which includes the entire phenomenon of ventricular electrical systole, depolarization and repolarization, that is, the QRS complex, the ST segment and the T wave. The segments are the PR or PQ, which goes from the end of the P wave to the initiation of the QRS complex, and the ST, from the end of the QRS complex to the initiation of the P wave. It is worth noting the union of the QRS complex with the ST segment, called point j.
Normal electrocardiogram
P wave
In the electrocardiographic recording of the body surface with the usual standard, atrial depolarization is manifested by a small rounded deflection, the P wave.
Duration. It represents the total depolarization time of the atria and varies with the age of the individual and the heart rate.
The duration of the P wave, generally obtained in DII, tends to be greater the older the age, varying from 0.06 to 0.09 sec. in children and from 0.08 to 0.11 sec. in adults; it is lower the higher the heart rate. These two factors are the most important and should always be taken into account when assessing the duration of a P wave to establish whether or not there are abnormalities of atrial depolarization. The mean duration of the P wave is 0.085 seconds.
Morphology. The normal P wave is rounded, monophasic, and occasionally has small elevations, so that between one peak and another there are no more than 0.03 seconds. In young, or sympathicotonic, individuals and in increases in heart rate, sharp P waves can be seen, but with a voltage that is within normal limits.
Amplitude. The maximum voltage of the P wave in normal individuals is between 0.25 and 0.30 mV, or 2.5 to 3mm, measured from the DII lead.
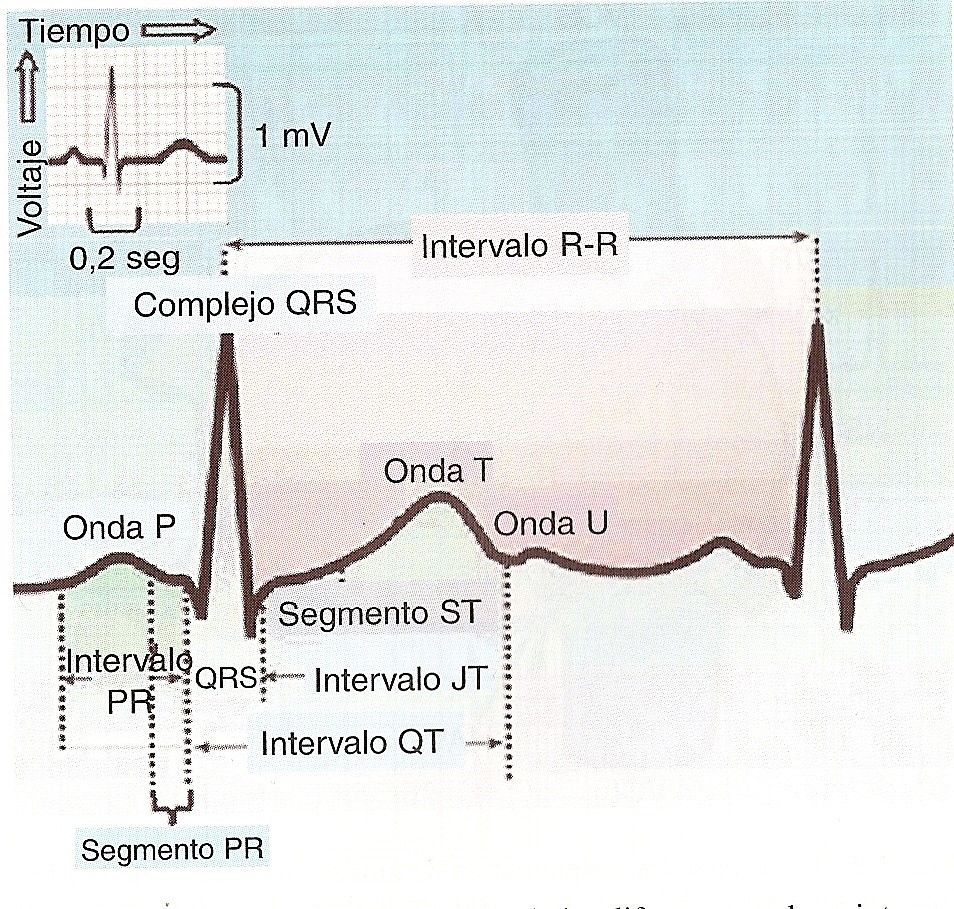 Fig. 11-13 Normal ECG waves and intervals. Fig. 11-13 Normal ECG waves and intervals.
|
Polarity. The P wave at the body surface can be positive, negative, or isoelectric, depending on the orientation of the atrial depolarization vector.
As already seen, the mean orientation of normal atrial depolarization points downward and to the left, with little or no backward tilt. For this reason, P waves are normally negative in the upper and right regions of the thorax, both anteriorly and posteriorly, and positive in the lower left region.
Between these two zones of positivity and negativity there is a narrow band where isodiphasic P waves are registered, demarcating the plane of transition potentials, called the 0 plane.
Orientation of the AP vector. The electrical axis of P in the frontal plane is normally situated, in about 97% of the cases, between + 30º and + 70º; the variation in this plane goes from -30º to + 90º; Values of around + 90º with isodiphasic waves in DI only, are recorded in the case of dextrocardia or more rarely in patients with heart disease. The mean normal orientation is considered to be around + 60º.
The axis or vector AP is named with the same hexaxial system and in the same way as we determined the vector AQRS.
PR segment and PR range
At the end of the P recording, an isoelectric segment, called PR segment, is inscribed on the ECG, which must be measured from the end of the P wave to the beginning of the QRS complex, whether it starts with a Q wave or an R wave Normally this segment does not present unevenness exceeding 0.5mm and has a tendency to register in the opposite direction to that of the preceding P, as the heart rate increases. The PR interval is measured from the beginning of the P wave to the initiation of the fast ventricular complex, whether it begins with an R wave or a Q wave. The PR varies with the age of the individual and with the heart rate, there are tables that They allow us to evaluate for a given case what is the normal maximum duration of this interval.
We normally consider that the PR should not exceed 0.20 seconds in adults.
QRS complex
Duration. The period during which the QRS complex is inscribed, which represents the total duration of depolarization of the ventricles, ranges from the initiation of septal depolarization - beginning of the Q wave - to the end of depolarization of the basal portions of the septum. and the ventricles, the end of the S wave. In the same way as for the P wave, the QRS duration tends to be the greater the older the individual is, and the lower the heart rate.
The duration of the QRS increases with age, even without changes in frequency, and with increases in body surface area. It is greater in athletes who present a certain delay in the final portion of the QRS complex.
Typically the QRS is enrolled in 0.05 to 0.16 seconds. A duration of 0.11 in adults is suspicious and appears very rarely in normal people; the most frequent is that it is related to disorders of the intraventricular conduction of the stimulus or with ventricular enlargement.
Morphology. The morphology of the normal QRS complex is extremely variable in the different observations. The projection, is a given derivation, of the three main vectors of the ventricular activation phenomenon, produces deflections of variable size and polarity, according to the spatial orientation of the derivation line and of each of the vectors. The anatomical position of the heart influences the recording of the normal QRS complex.
Later on, the different morphologies that the QRS complex and each of its waves - Q wave, R wave and S wave - can present will be mentioned according to the different pathological alterations of the heart.
Amplitude. The voltage of the QRS complex varies widely and depends on cardiac and extracardiac conditions, such as the conductive environment that surrounds the heart.
In children with a thin chest wall, the voltage is relatively large. Only the daily practice of electrocardiographic interpretation will make it possible to form a criterion for the approximate valuation of high voltage complexes in each particular case, in order to judge whether they are within or outside the normal limits.
Low voltage is considered to exist when no positive or negative deflection of the classic leads exceeds 5mm, or when the sum of all deflections R in DI + S in DI + R in DII + R in DIII + S in DIII do not exceed the 15mm.
In the precordial leads, low voltage is considered to exist when the amplitudes of the R wave plus that of the S wave do not exceed 9mm and 7mm in V2 and V6, respectively.
Obesity, pulmonary emphysema, effusions and edema are extracardiac conditions that favor the recording of low-voltage complexes.
Polarity. Middle ventricular depolarization, dominated by the high voltage of the electrical phenomena that occur during the electrical activity of the left ventricle, is normally oriented, in adult and normolineal individuals, downwards, to the left and backwards (vector II orientation). As a consequence, predominantly positive QRS complexes will be recorded in the antero-left and postero-left regions of the thorax, and predominantly negative complexes to the right of the precordium and in the regions near the right shoulder will usually be recorded.
Orientation of the AQRS vector. The electrical axis of the QRS in individuals, normally in the frontal plane, varies widely in the extremes from -40 to + 130º. Age and constitutional type are the main factors to be taken into account when guiding the AQRS. The mean direction of the vector in adults is + 40º, and + 60º in children from one to twelve years old.
In neonates the AQRS vector is directed to the right, down and forward, approximately at + 110º or + 120º. This is due to the predominance of the right heart at this age.
As the left ventricle undergoes its physiological development, the vector deviates to the left, in adults its normal position is towards this side. After forty years of age, AQRS at + 30º and + 40º are frequent.
ST segment
The interval between the end of the QRS complex and the initiation of the T wave is called the ST segment. The junction point between the end of the QRS and the beginning of the ST segment is called the j point.
Generally, there is no clear boundary between the ST segment and the initiation of the T wave, and both parts represent the ventricular repolarization process that begins at the inscription level of point j and ends at the end of the T wave.
The ST segment is isoelectric or has a slight unevenness.
Then T
It should be noted that in practice the isolated duration of said wave is not measured, and that this measurement is included in the calculation of the QT interval. The voltage of the T wave is relatively lower than that of the QRS, and it is assessed without great accuracy in everyday interpretation. High voltage T waves, tending to be pointed, appear mainly in the precordial leads and in normal individuals, vagotonic, or in sinus bradycardia.
The ventricular repolarization wave tends to be small in amplitude in leads in which the vector is oriented perpendicularly, and in sympathicotonic individuals with sinus tachycardia.
A T wave less than 0.1mV in DI is considered pathological. However, this fact was observed in normal individuals.
Morphologically, the T wave is rounded and asymmetric with the first portion slower than the second. The polarity of the T wave depends on the orientation of the AT vector. Said AT vector is determined, in the hexaxial system, according to the polarity of the T wave in the different leads, as it is done with the AQRS vector.
QT interval
The period between the initiation of the QRS complex and the end of the T wave is called the QT interval and corresponds to the total duration of ventricular electrical systole. In general, QT is best seen in the DII lead. The QT interval is longer in women than in men and varies inversely with heart rate. For this reason, when the QT segment or interval is determined, this interval must be corrected for the heart rate since at low heart rates, in the case of sinus bradycardia, the QT will be prolonged, and it will be shortened in sinus tachycardia.
The normal corrected QT is within 0.42 to 0.44 seconds. In order to determine the corrected QT, the QT interval is measured in hundredths of a second and then divided by the square root of the time of the RR time period. In this way it is possible to establish what is called the corrected QT for the heart rate.
Then U
After the T wave, a small rounded deflection called U wave can be observed, mainly in the precordial leads of V3 and V4. It has the same polarity as the T wave, at most 10% of its amplitude in the precordial leads. The amplitude of the U wave is inversely proportional to the heart rate, being higher in bradycardic athletes and lower in tachycardial children.
The genesis of the U wave is highly debated. Two hypotheses are supported: the first suggests that it is the result of the potential difference between the subendocardial muscles, especially the papillary muscles, and the subepicardial muscles during ventricular repolarization, probably secondary to differences in ionic concentrations. The second considers that it represents the repolarization of the fibers of the Purkinje system.
Pathological electrocardiogram
Ear growths
Right atrial growth. The electrocardiographic diagnosis is made by the following signs:
AP deviation to the right between + 60º and + 90º.
Increased P voltage in DII, DIII and aVF.
Symmetrical and peaked P waves in the same leads.
P wave of normal duration.
P diphasic and generally with a great predominance of its positivity, of the + + - type in V1 and V2.
Rapid inscription of the intrinsic deflection of P in V1 and V2.
This electrocardiographic pattern is the one usually found in the tricuspids (stenosis or insufficiency) of rheumatic origin. Signs of left atrial enlargement also appear in the mitrotricuspids due to added mitral stenosis or regurgitation.
Another condition that also determines right atrial growth is pulmonary ephysema with hypertension in the small circuit: chronic pulmonary heart (Fig. 11-14)
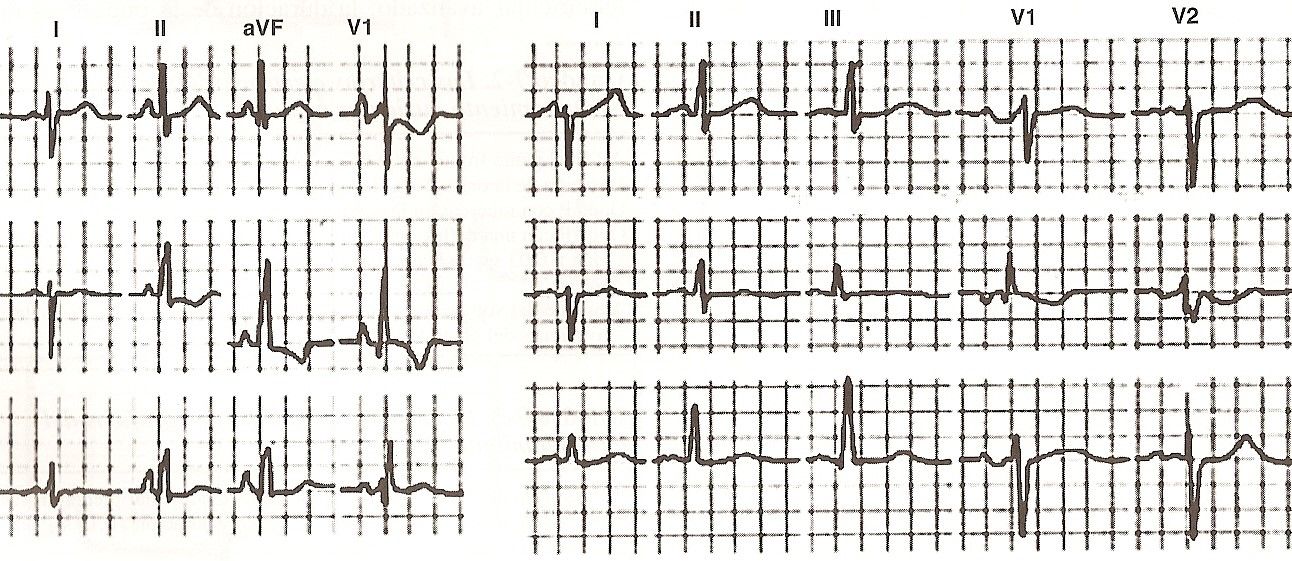 Fig 11-14 Growth of right atrium, Fig 11-15 Growth of left atrium |
1. AP deviation to the left, between + 30º and 0º.
2. Increased duration of the P wave, more than 0.11 sec.
3. P with notches and fillings in standard leads.
4. Increase in the voltage of the second peak of P, sign of hypertrophy.
5. P wave of type + - - in V1 and V2.
6. P bimodal in the precordial V3 and V4 or from V3 to V6.
Stenosis and mitral regurgitation are the conditions that produce the largest growths in the left atrium. Hypertension and aortic conditions follow in importance.
Binaural growth. To understand the electrocardiographic signs of growth in both atria, it is enough to point out that in conditions such as mitrotricuspids, in which there is hemodynamic or anatomical repercussion in both atria, the ECG can record the electrical alterations described for each of the growths at the same time. headphones (Fig. 11-16).
1. The axis of P deviates to the right to the left according to the predominant growth, or remains in a normal position if the growths are proportionally similar.
2. Standard variations may show notched and wide bimodal P waves of left atrial growth, with increased voltage of the first peak or mode, corresponding to right atrial growth.
3. In some cases the signs of left atrial enlargement are manifested in the standard leads (wide P and notched), while in V1 and V2 the P wave is diphasic with a predominance of positivity and rapid inscription of intrinsic deflection, which suggests added right atrial growth.
4. The reverse pattern is less frequent, that is, manifestation of right atrial enlargement in standard and left atrial enlargement in V1 and V2.
5. Signs of right atrial growth in the standard ones (AP on the right and P acuminate), accompanied by bimodal P waves in the precordial V3 and V4, or from V3 to V6.
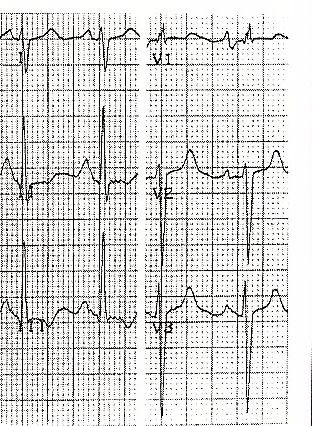 Fig. 11-16 Biatrial growths Fig. 11-16 Biatrial growths
|
Ventricular Growths
The electrocardiographic alterations found in ventricular hypertrophy are a consequence of the growth of the ventricular mass. In left ventricular hypertrophy, there is almost always anti-clockwise rotations of the heart about the longitudinal axis and horinzontalization of the same heart in relation to the anteroposterior axis.
Left ventricular hypertrophy (Fig. 11-17). It is characterized by the following electrocardiographic manifestations:
1. Increase in QRS voltage. In left ventricular hypertrophy, the magnitude of the septal vectors and the free wall of the left ventricle increases. It is known that vector I determines initial negativity, Q wave in V5 and V6, and positivity (R wave) in V1 and V2. In turn, vector II originates the R wave in the left precordial leads and the S wave in the right ones.
Therefore, when there is growth of the free wall of the left ventricle, we observe an increase in the voltage of R waves in leads V5 and V6, which are oriented towards the left ventricle, and of S in those leads that register the potential variations in the right ventricle, such as V1 and V2. In cases of septal hypertrophy, Q waves of higher voltage and longer duration are seen in V5 and V6 (Fig. 11-18).
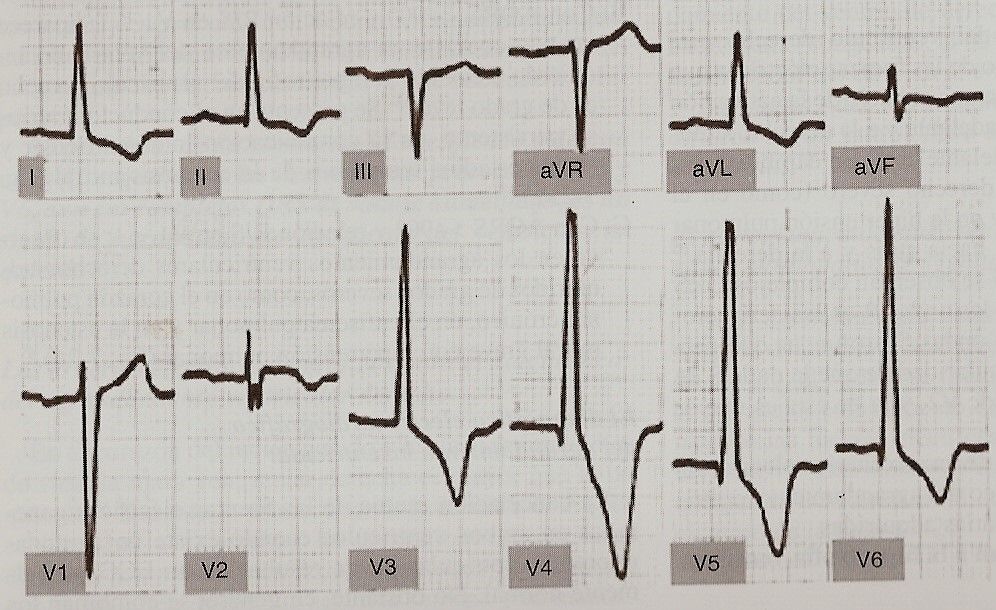 Fig 11.17 Left Ventricular Overload Fig 11.17 Left Ventricular Overload
|
2. Delay of intrinsic deflection. In addition to the increase in the magnitude of vectors 1 and 2, the increased thickness of the ventricular muscle requires a longer activation time; the bipolar wavefront has to travel a greater space, and for this reason the time that elapses between the beginning of ventricular activation (beginning of the QRS complex) and the apex of the R wave is increased in V5 and V6. Normally this time, or intrinsic deflection inscription time, is not greater than 0.045 sec. in such derivations. If the intrinsic deflection is registered in a longer time it is a sign of great value in the diagnosis of left ventricular hypertrophy.
3. AQRS deviation to the left. Along with the above, changes occur in the anatomical and electrical positions of the heart. In relation to the former, the heart frequently rotates on its anteroposterior axis and assumes a horizontal position. Simultaneously it rotates on its longitudinal axis in an anti-clockwise direction. This type of turn is recognized by the presence of a Q wave in DI and an S wave in DIII, called Q1S3. The anticlockwise rotation or levorotation, together with the horizontal position, determine that vector II, the most powerful in this variety of ventricular hypertrophy, points to the left, up and back. It is understood that the mean vector of ventricular activation is deviated to the left and up in the Eindhoven triangle or hexaxial system, and that the voltage of the R wave increases in aVL.
4. Transition plane to the right. Levorotation determines that a greater left ventricular area is exposed in the anterior aspect of the heart. For this reason, there are more precordial leads that record the unipolar morphology of the left ventricle, for example from V3 to V6.
The RS transition complexes that correspond to the anterior and lower right septal mass are recorded in the precordial region, further to the right than normal. This sign is known as the right shift of the transition plane.
5. Lewis index. It is known as the Lewis index, which is expressed in the following equation.
(R1 + S3) - (R3 + S1) = magnitude in mm.
Normal values of the Lewis index are between +17 and -14mm. Values greater than +17 are strongly suggestive of left ventricular hypertrophy. However, in some young people with vagotonia and in athletes, indices with values greater than + 17mm are frequent, without being able to demonstrate left ventricular growth.
6. Changes in the ST segment and in the T wave. In left ventricular hypertrophy there are changes in ventricular repolarization, that is, in the ST segment and in the T wave, not only related to the greater thickness of the ventricular muscle, but also also with the type of hemodynamic overload imposed by heart disease. In left ventricular hypertrophy, the T waves in the left precordial leads V5 and V6 are negative, opposite to the positive area of the QRS. The greater muscle thickness of the free wall of the left ventricle delays the activation of the muscle near the epicardium and consequently the repolarization of the same muscle, to such an extent that this delay is greater than the normal one determined by the intraventricular pressure on the muscle near the endocardium. . Therefore, the vector of repolarization in ventricular growths goes from the epicardium to the endocardium, moving away from V5 and V6. For this reason, the presence of T (-) waves is observed in these precordials, and that the AT vector in the frontal plane deviates to the right by + 90º, opposing the aqrs which deviates to the left at approximately 0º.
We speak of systolic overload of the left ventricle when a cardiac chamber encounters resistance in its emptying (aortic or pulmonary stenosis, arterial hypertension, etc.). In this case, at the precordial leads V5 and V6, frankly positive R waves will be observed, with ST segment and negative T waves and AQRS deviating frankly to the left.
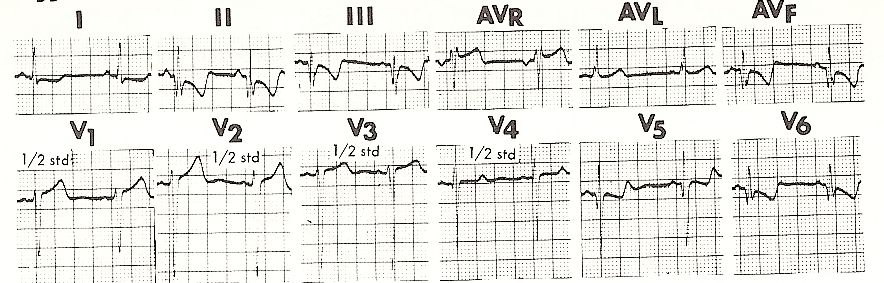 Fig 11-18 LV overload Septal hypertrophy |
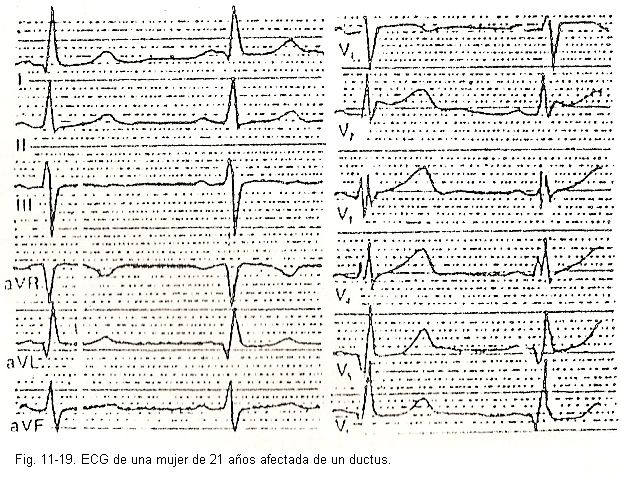
 On the other hand, in the diastolic overload of the left ventricle, when a dilation of this cavity occurs fundamentally (aortic or mitral regurgitation, persistence of the arterial duct, etc.), positive, high T waves will be found; they tend to be pointed at V5 and V6 and the AT vector does not oppose the AQRS.
Associations of diastolic overload with systolic overload can be found, for example, in aortic stenosis associated with aortic or mitral regurgitation.
 Ventricular septal defect complicated with pulmonary hypertension is an example of mixed left ventricular diastolic and right ventricular systolic overload.
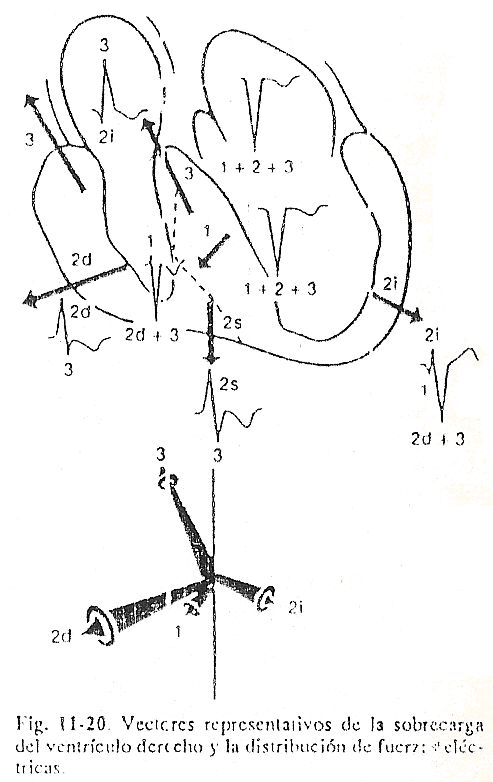
Right ventricular hypertrophy. In the right ventricle, as in the left, hypertrophy is accompanied by an increase in the thickness of the muscle, by changes in the position of the heart, and frequently by dilation of the ventricular cavity. This results in the succession of heart activation being modified, either by the presence of new vectors or by the different orientation and magnitude of normal vectors (Fig. 11-20).
The greater thickness of the free wall of the right ventricle, the lower right intraventricular septum, and the basal portions of the ventricle itself determine important electrical forces that we have identified as characteristic vectors of ventricular growth.
Vector 1, which corresponds to septal activation, is usually normal and points to the right, down, and forward. In few cases with great hypertrophy and right ventricular dilation, the intraventricular septum is located parallel to the frontal plane and the first vector is oriented, unlike the normal one, to the left, forward and downward. When vector 1 is normal it contributes to R in V1 and V2 and determines Q wave in V5 and V6. If vector 1 is oriented to the left, the Q of the left leads disappears and a small Q can instead be inscribed in V1 and V2.
Vector II, which normally corresponds to the depolarization of the free wall of the left ventricle (vector II left), appears smaller when balanced by vector II right, corresponding to the important forces of the free wall of the right ventricle. For the same reason, the left vector II changes its orientation, which is now forward, down, and to the left, instead of backward as usual.
The relatively small R wave in V5 and V6 is explained by left vector II in right ventricular overload. The forces of the free wall of the right ventricle, increased in magnitude proportionally to the degree of hypertrophy, are represented by the right vector II, which points to the right, down and forward and determines high R waves in V1 and V2 and deep S in V5 and V6. The basal forces are represented by vector III, which is similar to normal in direction, but of much greater magnitude when right ventricular hypertrophy extends to the basal regions. In few cases vector III is more important than vector II right. For now, all vectors move away from the left cavities, which is why intracavitary QS complexes are recorded.
Vector I points to these places and determines initial positivity. Vectors II right, II left, and III move away and are responsible for S waves. If the hypertrophy of the ventricular mass reaches the lower and anterior portions of the interventricular septum, which correspond to the right septal mass, the electrical forces corresponding to the vector II right and concomitantly to the R of the transitional complexes of V3 and V4.
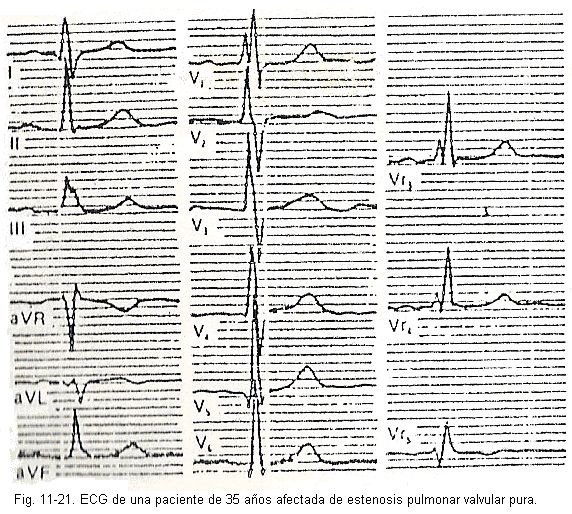 Ventricular hypertrophy can have different locations according to the disease. The electrical signs that suggest right ventricular enlargement are as follows (Fig. 11-21)
1. Increase in QRS voltage. When the hypertrophy of the free wall of the right ventricle predominates, the greater thickness of this wall determines an important right vector II, whose magnitude exceeds that of the forces of the left ventricle or left vector II. Ventricular complexes are of the Rsr or R or qR type in V1. When hypertrophy predominates in the basal portions of the right ventricle, deep S waves will be found, not only in V5 and V6, but sometimes even V1 to V6. When the hypertrophy is of the lower portions of the right septal mass, an increased voltage of the R wave will be observed in the transitional complexes.
2. Delay of intrinsic deflection. The intrinsic deflection of the right ventricle in V1 or V2 corresponds to the portion of the QRS complex that is inscribed from the highest positivity to the isoelectric line. Normally this portion does not exceed 0.035sec. Therefore, values above these are considered as delays in the inscription of the intrinsic deflection.
3. AQRS deviation to the right. It has already been explained how the vector forces in the different types of right ventricular hypertrophy deflect the AQRS to the right. It should be added that there are also changes in the anatomical and electronic positions of the heart, which favor this rotation. The heart can rotate on its longitudinal axis in a clockwise direction, which determines the appearance of S waves in DI and Q in DIII. In other words, it is what is called S1Q3 hourly rotation
4. Transition plane to the left. When right ventricular hypertrophy is important and the interventricular septum is placed closely parallel to the frontal plane, a greater area of the right ventricle is projected onto said plane, for which reason more precordial leads record the variations in potential of the same right ventricle . For this reason, in these leads the morphology of the right ventricle is recognized not only in V1 and V2, but also in V3 and V4 and sometimes up to V6. Complexes are recorded to the left of this usual site, in V5 and V6, instead of V3 and V4. In other words, there is deviation to the left of the transition plane, and therefore in leads V5 and V6 we will have RS.
5. Lewis index. The greater magnitude of vectors II and III determines an increase in the voltage of the S wave in DI and DIII, where it turns out that the Lewis index reaches values lower than -14mm. The higher the degree of ventricular hypertrophy, the higher the negative values in the index.
 6. Changes in the ST segment and in the T wave. The T wave in V1 and V2 is normally negative in children; the presence of positive T waves in V1 and V2 before two years is pathological and suggests right ventricular enlargement. However, if the ventricular hypertrophy is considerable, the T wave becomes negative and even ischemic in type, that is, negative, symmetric and acuminate.
7. Opposition of vectors AT and AQRS. Explanations similar to those outlined for left ventricular hypertrophy can be given in right ventricular hypertrophy, to understand why the AT vector is directed backward and to the left, sometimes up, sometimes down. If there are no primary disorders in ventricular recovery due to myocardial damage added to hypertrophy, the opposition between AT and AQRS is characteristic in the frontal plane.
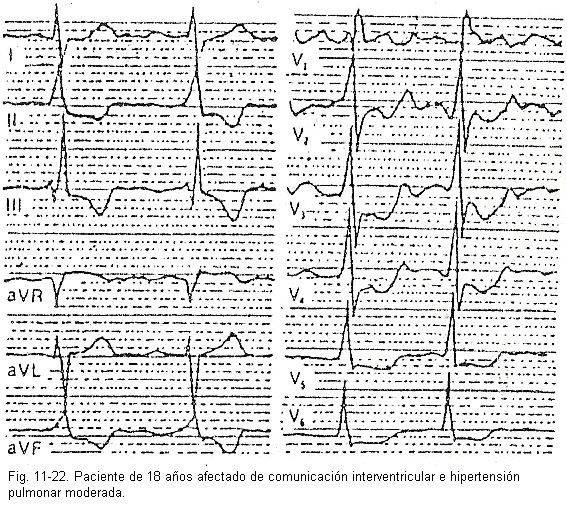
Biventricular hypertrophy. Hypertrophy of both ventricles is recognized by a combination of the aforementioned signs, with those of the mainly affected ventricle prevailing (Fig. 11-22)
Branch blocks
When the sinus stimulus spreads at a slower speed or stops in one of the branches of the bundle of His, we speak of a right or left bundle branch block, depending on the branch in question. According to the degree of depolarization of the damaged branch, they are divided into complete blocks and incomplete blocks.
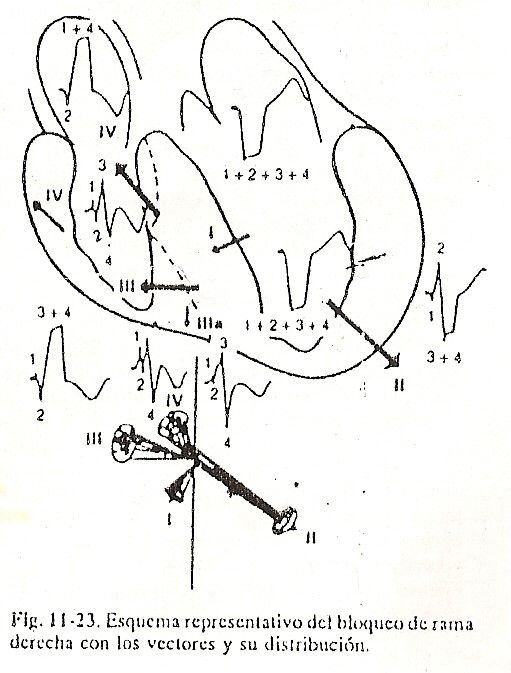 Right bundle branch block. Complete right bundle branch block will be described first. When the right bundle branch injury blocks the stimulus, ventricular activation is significantly altered. To facilitate understanding, we have summarized the activation as a function of four vectors, which satisfactorily explain the unipolar morphology of complete right bundle branch block (Fig. 11-23).
Vector I or septal vector. The stimulus going down the left branch descends normally and activates the middle third of the ventricular septum as in normal conditions. That is, vector I is the same as the normal one and points to the right and forward, and also up or down depending on the position of the heart. This vector determines a small initial positivity or r wave in the right ventricular epicardium in V1 and V2, and a small initial negativity or Q in the left ventricular epicardium and in V5 and V6.
Vector II or vector of the free wall of the left ventricle. As in normal activation, this vector corresponds to the electrical forces of the free wall of the left ventricle. The vector points to the left and slightly back, and down or up depending on the position of the heart. Vector II of right bundle branch block produces the R wave of the left ventricular epicardium and V5 and V6, and a relatively small negativity or S wave in the right ventricular epicardium and in V1 and V2; in the lower portions of the right ventricular cavity it produces an S wave similar to that of V1 and V2.
Vector III or wave jump vector. This vector has no homologous in normal ventricular activation. It is the representation of a characteristic form of septal activation in advanced right bundle branch block. It corresponds to the slow activation that takes place in the physiological barrier of the interventricular septum. That is, it is a slow propagation of the stimulus that advances from left to right and takes about 0.02 sec. in jumping the barrier, and then it extends in the opposite direction to normal in the right septal mass, that is, from left to right. The large vector points forward, to the right, sometimes up and sometimes down. This vector gives rise to the ascending branch of the R wave and the initial part of its plateau in the epicardium of the right ventricle, that is, in V1 and V2; to the S wave, pasty, of the epicardial unipolar lead, of the left ventricle in V5 and V6; to the R1 of the right intracavitary potential, since this vector, being located in the lower part of the interventricular septum, points towards the cavity; apart from the intracavitary unipolar negativity of the left ventricle and the left atrium, it gives the ascending branch of R and the beginning of its plateau in the cavity and epicardium of the right atrium.
Vector IV or vector of activation of the basal portions. This vector results in dipoles that activate the anterior and upper portions of the right septal mass near the pulmonary cone, the supraventricular crest, and the upper third of the free wall of the right ventricle.
Its spatial orientation is forward and slightly to the right and up. It gives rise to the final portion of the R1 plateau in the unipolars of the right ventricular epicardium and in V1 and V2; to the final filling of the S wave in the unipolar ones of the left ventricle, and in V5 and V6; to the part of the negativity of the left atrial and ventricular intracavitary recording; to the final negativity of the S wave in the unipolar wave obtained at the tip of the right ventricular cavity; to the final portion of the filling of R in the unipolars of the epicardium and the right atrial cavity.
The student must remember the following morphologies found in advanced right bundle branch block: the unipolar of the right ventricular epicardium registered in V1 or in V1 and V2 is of the rsR type, with a plateau filled in the vertex of R; r is due to vector I or septal vector, s is produced by vector II or vector of the free wall of the left ventricle, and R with its plateau is caused by the summation of vectors III and IV. The unipolar of the epicardium of the free wall of the left ventricle is of the QRS type, with a filled S wave; it is recorded mainly in leads V4 and V5, and in horizontal hearts in DI and aVL: the Q wave is produced by vector I or septal vector, which moves away from V5 and V6; the S wave, S plastered, it results from the summation of vectors III and IV that move away from the left ventricular epicardium. The unipolar of the left atrium is of the QS type and is recorded mainly in aVL when the heart is vertical. The unipolar of the right atrium is of the qR type, with a packed R wave and with plateau, and it can sometimes be recorded in V1 or in V1 and V2. The unipolar of the right ventricular cavity is of the rsRS type, with pasted R and S waves. It is the typical M-shaped morphology that can occur in tracings with complete right bundle branch block; it is given by a small r wave, a small s wave, an augmented R wave and an S packed in its duration. The unipolar of the right atrium is of the qR type, with a packed R wave and with plateau, and it can sometimes be recorded in V1 or in V1 and V2. The unipolar of the right ventricular cavity is of the rsRS type, with pasted R and S waves. It is the typical M-shaped morphology that can occur in tracings with complete right bundle branch block; it is given by a small r wave, a small s wave, an augmented R wave and an S packed in its duration. The unipolar of the right atrium is of the qR type, with a packed R wave and with plateau, and it can sometimes be recorded in V1 or in V1 and V2. The unipolar of the right ventricular cavity is of the rsRS type, with pasted R and S waves. It is the typical M-shaped morphology that can occur in tracings with complete right bundle branch block; it is given by a small r wave, a small s wave, an augmented R wave and an S packed in its duration.
Alterations at the T wave level. The T wave in the unipolar leads of the epicardial right ventricle, right intracavitary and right atrial, is negative. The negativity of T in the bundle branch block, in this case a complete right bundle branch block, is due to the fact that the recovery of the interventricular septum becomes more important than the recovery of the free wall of the left ventricle. The recovery process in right bundle branch block begins, as does depolarization, on the left septal surface and extends forward, to the right, and up. The vector of such recovery is represented by an arrow that goes from right to left, and from top to bottom and backwards, that is, in the opposite direction to the path followed by recovery, pointing towards the septal surface and the left ventricular chamber and away from the right ventricular chamber, the right epicardium and the right atrium. For this reason, positivity is recorded in the cavity and epicardium of the left ventricle and negativity in the cavity and epicardium of the right ventricle.
Complete right bundle branch block is a common finding in coronary patients or patients with cardiomyopathies of various etiologies. It is also seen in some cases of rheumatic endomyocarditis with tricuspid lesions and in patients with congenital heart disease. Exceptionally, it can be found in people with normal heart, symptoms, and radiography (Fig. 11-24).
Incomplete right bundle branch block. In incomplete blocks, the stimulus descending the right branch is delayed, but reaches the ramifications of the right Purkinje network and activates part of the right septal mass before the activation front descending the left branch reaches these sites. In other words, the wavefront descending the right branch activates a portion of the right ventricle and the interventricular septum. When the delay is small, the activation of the right ventricle is carried out almost exclusively by the wave front extending from the right Purkinje, and only a slight asynchronism is observed in the delay ventricular activation of the right ventricle.
The basal right vectors are posterior to the basal vectors of the left ventricle. As they have no opposition, they look bigger than normal, and on the other hand they point backwards, to the right and slightly downwards. This form of final activation is characteristic of grade 1 incomplete right bundle branch block.
The delayed vectors determine a terminal small S wave slightly jammed in V6 and a notched rS complex or rSR 'in V1.
When the block is greater, the delay of the right ventricle is also greater. Now, the activation front down the right branch is more delayed than the first activation front of the left septal mass. This greater asynchronism causes the vectors of the anterior face of the right ventricle to predominate over the borders of the left ventricle; this, in turn, creates a new vector that points to the right and forward, sometimes up, sometimes down, giving rise to a higher voltage S wave in V6 and a higher positivity, or R ', in V1 without plateau appreciable. This form is characteristic of grade 2 incomplete right bundle branch block.

Fig. 11-24 Complete Right Branch Block plus Anterior Hemiblock |
Incomplete right bundle branch blocks are frequently associated with hypertrophy or dilation of the right ventricle. They can be seen in rheumatic heart disease with pulmonary hypertension (mitral stenosis), in acute pulmonary heart disease, and in congenital conditions such as atrial septal defect.
Left bundle branch block. As with right bundle branch block, complete left bundle branch block and incomplete left bundle branch block can be considered.
In complete left bundle branch block, the stimulus does not go down this bundle and ventricular activation is done in a totally different way than normal. Indeed, the activation begins in the distribution zone of the Purkinje network that arises in the right branch of the bundle of His. This muscle portion is located at the base of the right papillary muscle, near the trunk area. For this reason, the first portion
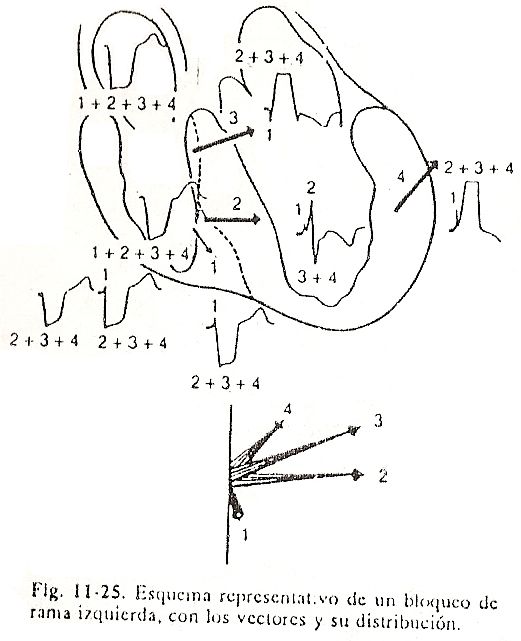 Fig. 11-25 Left Branch Block of the myocardium that depolarizes corresponds to the lower surface and the right septal mass. At this level, the thickness of the septal myocardium is very reduced, and the activation front quickly reaches the intraseptal barrier, jumps said barrier and activates in the opposite direction to normal, from right to left, the thickness of the left septal mass and then reaches the free wall of the left ventricle. This form of activation produces significant ventricular asynchronism with late activation of the left ventricle. In complete left bundle branch block, or grade 3, activation is represented by four main vectors (Fig. 11-25 and 11-26).
Vector I or vector of the right, anterior and lower septal mass. This vector represents the initial activation of the right septal mass, near the base of the anterior papillary muscle, to later extend to the anterior and lower right septal mass. The vector points forward, down, and slightly to the left. It is of small magnitude, for which a small R wave is manifested in V1 and V2 and by a small positivity or notch in the ascending branch of R in V5 and V6. Therefore, there is no Q wave. Sometimes, the ventricular complex of V1 or V4 is negative of the QS type, because the first vector is very small or because its orientation is not adequate for it to manifest in the right precordial records. In the first vector,
Vector II or vector of wave jump and low left septal mass. This vector is the result of the jump of the intraseptal barrier and the activation of the lower left septal mass from right to left. The wave jump lasts approximately 0.02 sec. and the depolarization of the lower left septal mass takes between 0.04 and 0.06 sec. Vector II is located in the thickness of the lower portion of the interventricular septum and points backwards and to the left, and also up or down depending on whether the heart is horizontal or vertical. Vector II is large in magnitude and points to the left ventricular cavity. This vector determines the ascending branch of the R wave recorded in the left chambers and epicardium of the left ventricle and in leads V5 and V6.
Also of the ascending branch of the R wave registered in the left chambers and epicardium of the left ventricle and of the precordial leads of V5 and V6. Also from the descending branch of the ventricular complex obtained in the right atrial and ventricular cavities, in the right epicardium and in the precordial ones from V1 to V4.
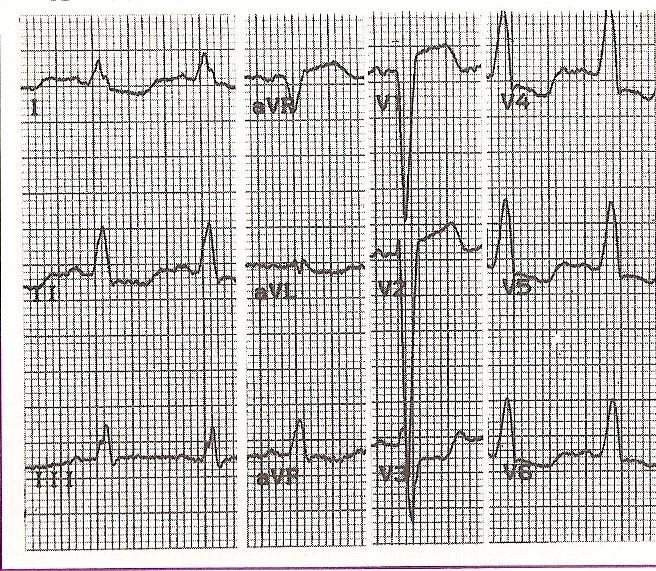 Fig. 11-26 Complete Left Branch Block Fig. 11-26 Complete Left Branch Block
|
Vector III or vector of the upper two thirds of the left septal mass. This force is represented by a vector that crosses the interventricular septum in its upper two thirds. The vector points backwards, to the left and upwards, but spatially it is more anterior to vector II. The arrow can be imagined pointing to the upper portions of the left ventricular chamber. Vector III gives rise to most of the R plateau showing more notches and fillings in the unipolar leads recorded in the left epicardium, in V5 and V6, and in the left atrium. It also causes the pasty portion of the QS complexes in the unipolar recordings obtained in the right atrium and ventricle, as well as in the unipolar ones from V1 to V4.
The notches and fillings can be explained by the reverse direction that the activation process follows in the left septal mass, that is, instead of going from the Purkinje network to the muscle, it now advances from the muscle to the Purkinje network.
Vector IV or vector of the free wall of the left ventricle. This vector crosses the upper third of the free wall of the left ventricle, points backward, to the left, and upward, but is anterior to vectors II and III. Vector IV contributes to the plateau and the descending branch of R in unipolars obtained in the atrium and left ventricular epicardium, as well as in V5 and V6. It is also responsible for the final part of the QS complex of the recordings obtained in the right cavities and epicardium and in the precordial leads from V1 to V4. The joint action of vectors III and IV gives rise to the S wave of the left ventricular cavity.
Hemiblocks. As already seen, the trunk of the left branch of the bundle of His branches initially in the posteroinferior division, which goes to the base of the posterior papillary muscle, and then to the longer and thinner anterolaterosuperior division, which later from crossing obliquely the left ventricular outflow pathway continues towards the anterior papillary muscle. At the level of the last division, it presents, in its proximal portion, an important anatomical relationship with the right branch of the bundle of His. Rosembaum et al. showed the practical importance of blocks of the divisions of the left branch, which they called “hemiblocks”: left anterior hemiblock and left posterior hemiblock. These authors accumulated elements to broadly unify concepts about this driving disorder, and they established the criteria for its correct diagnosis and electrocardiographic interpretation. We must emphasize that the anterior and posterior designations are not related to the orientation of the mean vector of ventricular depolarization, but to the terms used to designate anatomically the two divisions of the left branch.
These conduction disorders should be more correctly designated as superior division and inferior division left bundle branch blocks. As will be seen later, the deviation of the AQRS in the frontal plane is the most important data for making the diagnosis of these types of conduction disorders.
Thus, what matters in the anterior hemiblock is the left and laterosuperior location of the blocked region, which leads to a deviation of the ventricular depolarization axis upwards, to the left and not forward. In the posterior hemiblock, and since the area that lags is located inferiorly in the septal region, the AQRS deviates downward and to the right.
The increase in the duration of the QRS complexes is usually less in hemiblocks than those registered in complete bundle branch blocks, since there is no need for the stimulus to arrive from the opposite unblocked ventricle through the intraventricular septum, as occurs commonly in right bundle branch block or left bundle branch block. When there is a blockage of one branch division, the stimulus walks through the uncommitted branches of the other and depolarizes the Purkinje network dependent on the blocked fascicle through interparenchymal connections.
Left anterior hemiblock. The electrocardiographic characteristics of anterior hemiblocks are as follows:
1. AQRS a -60º.
2. Presence of Q in DI and S in DIII.
3. Presence of S in DIII greater than S in DII (Fig. 11-27).
Other variants that we can find are the following:
The width of the QRS ranges from 0.06 to 0.13 seconds. This indicates that the anterior hemiblock can occur with any width of the QRS.
The PR interval is normal. In precordial leads, one of the fundamental characteristics is the persistence of S up to lead V6 and, generally, the disappearance of Q waves in lead V4, lead V5 and V6. Both the persistence of the S wave until V6, and the absence of Q waves in the left leads, are inconstant phenomena.
That is why there are different degrees of anterior hemiblocks, where the presence of Q waves can be observed in V4, V5 and V6.
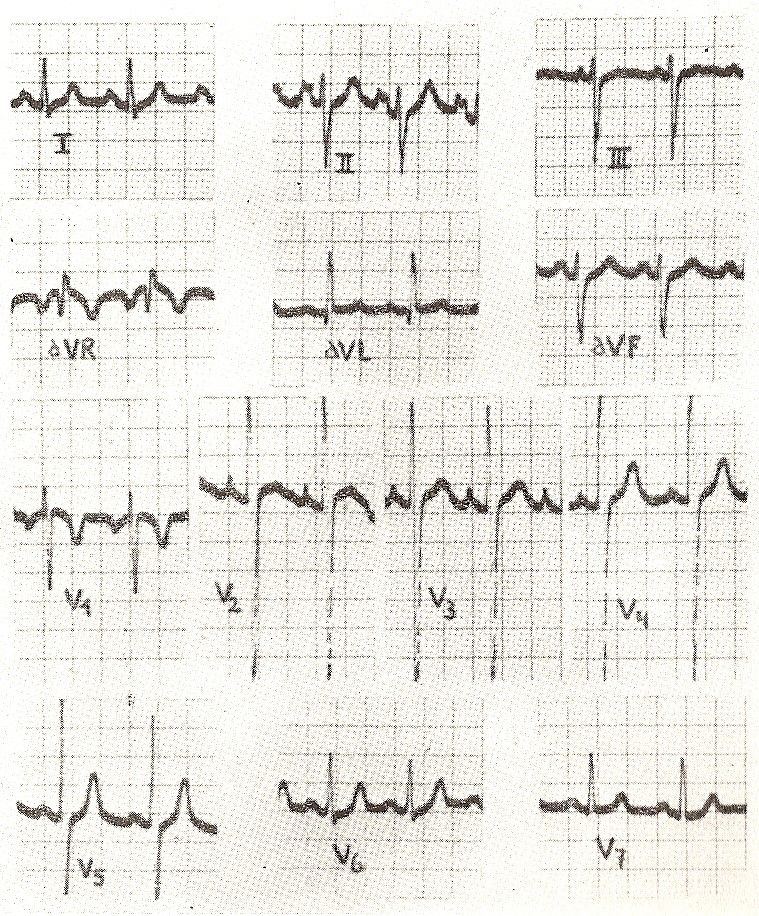 Fig.11-27 Hemibloqueo Anterior. Fig.11-27 Hemibloqueo Anterior. |
Posterior hemiblock. Less frequent and more difficult to identify with certainty is the left posterior hemiblock, since vertical hearts and patients with right ventricular hypertrophy give very similar findings, which is why the doctor may be unable to decide due to the presence of one or the other. eventuality (Fig. 11-28).
On the contrary, detecting an unusual deviation of the axis to the right, key to the diagnosis in a patient with severe left heart disease, will become a link of great importance in clinical reasoning.
In posterior hemiblock, ventricular activation begins with forces directed upwards, discretely to the left (around -80ª) and directly forwards, as the anterosuperior division depolarizes, then the deflections r in DI, q in DII and q in DIII. In the following period, the orientation of the QRS is downward and to the right, registering the deflections S in DI, R in DII, and R in DIII, with wide R waves. In posterior hemiblock, therefore, the AQRS deviates toward + 120º and the ventricular complexes are of normal duration.
Posterior hemiblock is frequently associated with complete right bundle branch block. In these cases, the QRS duration is longer than normal, not due to the presence of the hemiblock but because of the complete right bundle branch block. In the frontal plane, clockwise rotation is recorded in the posterior hemiblock. Posterior hemiblock is rare and is frequently associated with complete right bundle branch block; Its presence should be suspected when a clear deviation of the AQRS to the right and down is observed in a left ventricular overload patient, in the absence of right ventricular overload, chronic pulmonary heart, anterolateral infarction or very verticalized heart.
According to Rosembaum et al., The posteroinferior division is the least vulnerable structure to pathological attacks of the entire intraventricular conduction system. This fact would be related to anatomical factors (greater thickness and shorter length) and physiological factors (greater dromotropism) as well as a dependent vascularization of the right and left coronaries. Thus, whenever a posterior hemiblock appears, it is highly probable that there is already a prior compromise of other sectors of intraventricular conduction.
Bilateral bundle branch block. This is an association of electrocardiographic data suggesting a concomitant lesion of both branches of the bundle of His or the right branch plus one of the left hemirramas. What has been described constitutes a bifascicular block, while if it is possible to deduce, through the evolution of the tracings, lesions of the right branch and of the two left hemirramas, we would speak of trifascicular blocks. The situations can be inferred by the finding of any of the following combinations: right bundle branch block plus left anterior hemiblock; right bundle branch block plus posterior left hemiblock. Alternating right bundle branch block with left bundle branch block, one bundle branch block plus first degree or second degree atrioventricular block.
Indeterminate intraventricular block. The tracings show an evident delay in the total duration of the QRS with notches and fillings of the same, but they do not reach an unequivocal identity to be able to attribute it to the right branch or the left branch. They are usually an expression of serious and diffuse myocardial lesions, fibrosis, post-myocardial infarction sequelae, endomyofibrosis, myocarditis, etc.
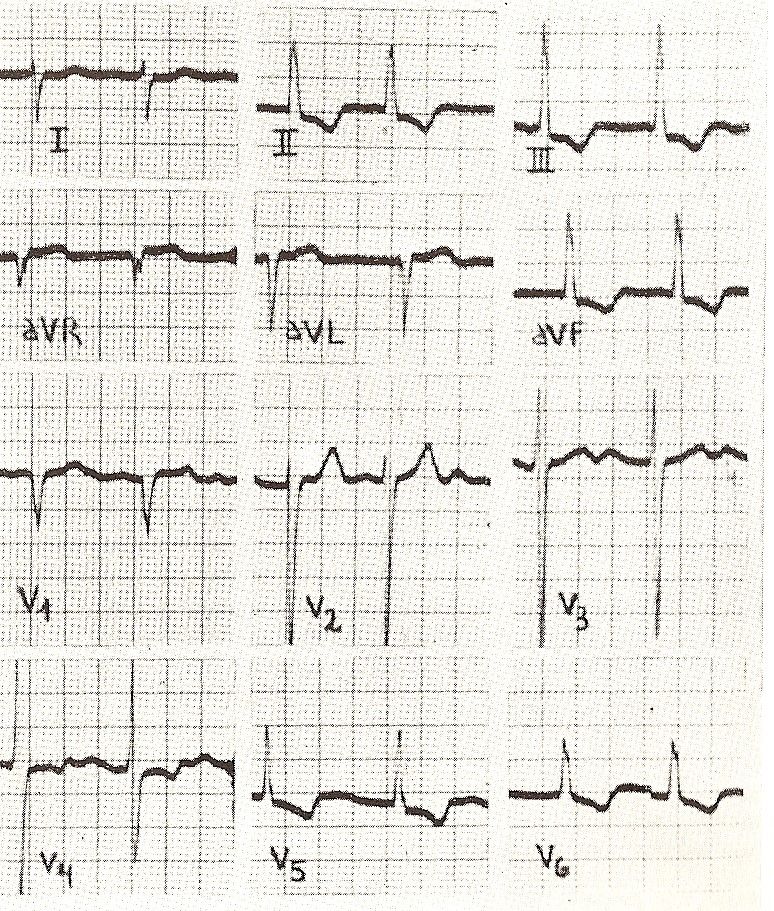 Fig.11-28 Hemibloqueo Posterior |
Coronary heart disease
Myocardial infarction, an extreme degree of circulatory disturbance, is caused by the interruption, more or less sudden, of the flow in a branch of the coronary arteries. When fully constituted, it presents coarsely concentric areas of smaller size starting from the necrotic area, which on the ECG are translated as areas of injury and ischemia located between the areas of necrosis and healthy tissue. It should be noted that the electrocardiographic patterns of ischemia, injury and necrosis, more or less well defined and accepted, arise from the experience accumulated from patients with coronary artery disease, as well as from research processes carried out in animals with the intention to elucidate the electrogenesis of myocardial activation and recovery disorders.
In electrophysiology, myocardial necrosis is represented by a tissue that totally loses the ability to be activated, behaving as a simple conductor of potential differences existing in other areas of the heart. This means that the necrotic area does not contribute its vectors to the ventricular depolarization process, thus modifying the morphology of the QRS.
As the depolarization of the necrotic area does not occur, the potentials originated by the depolarization of opposite regions remain as released and predominate in the electric field.
As a result of this, the activation escapes from the compromised area, emerging vectors that are directed from the electrically negative area of necrosis towards the relatively positive healthy tissue.
An explorer electrode placed looking at the area of necrosis will record an initial negative wave, deep Q wave, or just R wave of lower voltage than previously recorded (Fig. 11-29).
Dead tissue Q waves have several characteristics that should be remembered:
1. It is a deep Q wave, the voltage of which is generally greater than 25% of the R that follows it.
2. It is a wide Q wave with a duration of 0.04sec or more; the duration of Q is proportional to the extent of the dead tissue, while the depth or voltage is proportional to the thickness of the necrotic tissue.
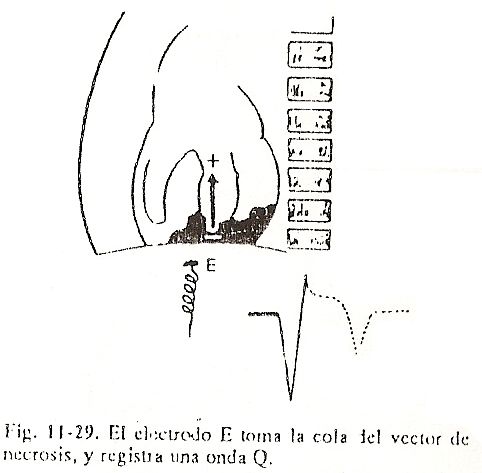 The following is an example: in acute inferior myocardial infarction, deep Q waves are observed in leads DII, DIII, and aVF, since they are the leads that look directly toward the inferior face of the heart.
When necrosis is localized in the anteroseptal region of the myocardium, the initial forces of ventricular depolarization point backward. There will then be decapitated R waves in V1, V2 and V3, with the ventricular complexes replaced by Qr-type complexes or directly by the inscription of a single negative wave called the QS wave, instead of being rS.
Theoretically, in the resting heart, all cells are polarized and an electrode placed on their surface would not pick up a potential difference. When a myocardial injury occurs, whether due to blood supply disturbance or any other factor, a potential difference arises between the electronegative compromised area and the electropositive healthy muscle. This potential difference to which we refer, would be due to an alteration between the intracellular concentration and the extracellular concentration of potassium. The injured tissue can also be defined based on this relationship, saying that it is that tissue in which there is a gradient or a drop in the ratio of intracellular potassium and extracellular potassium.
Fig. 11.30. Tissue M = dead L = injured
I = ischemic N = normal
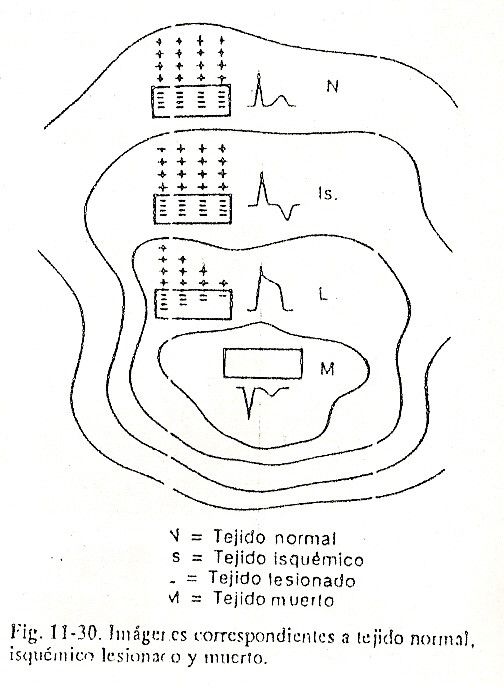 La despolarización se retarda tanto mas cuanto mayor es el grado de lesión. Ello significa que a mayor lesión mayor retardo en la despolarización sistólica o activación. La despolarización lenta del tejido lesionado determina retardo en la recuperación; como resultado de este retardo en la activación, las fuerzas eléctricas del tejido lesionado duran más y se manifiestan con mayor magnitud que las normales. Todas las fuerzas eléctricas anormales del tejido lesionado pueden representarse por un vector único llamado vector ST o vector de lesión.
Injury vector. This vector originates in normal tissue adjacent to the injured tissue and ends in the center of the injury. In the places where it points (diseased tissue) it determines positivity, while it gives negativity in the places where it moves away. The location of the injury site must always be taken into account, whether it is predominantly subepicardial or subendocardial. When it predominates in the subepicardium, in the leads directed towards the epicardium or towards the infarct region, positive differences will be registered –that is, upwards of the isoelectric line- of the j-point and the ST segment (Figs. 11-30 and 11-31).
Taking as an example an area of subepicardial lesion located on the inferior face of the ventricular myocardium, the resulting vector will point from top to bottom, and will therefore produce positive elevation of the j point and the ST segment in DII, DIII and aVF.
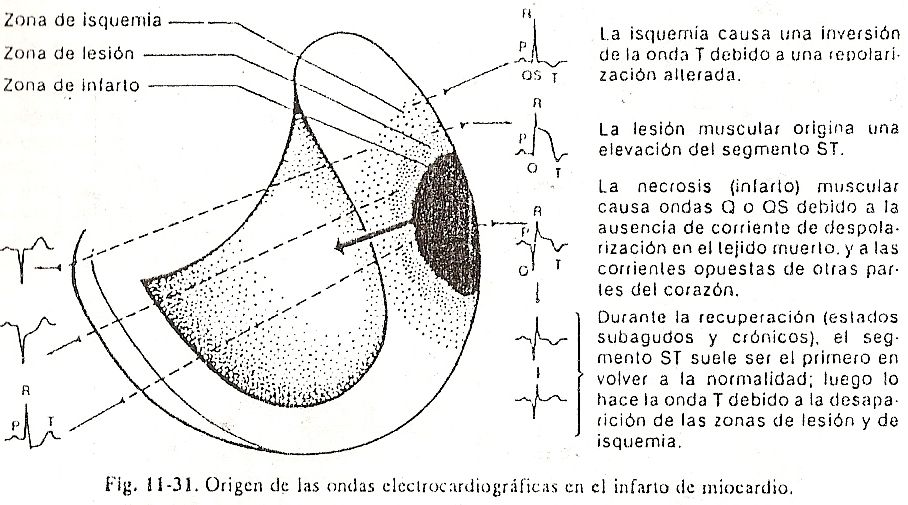 Ischemia vector. From the electrocardiographic point of view, it is said that there is ischemia of a region of the myocardium when the repolarization process is delayed in that area. This phenomenon can be represented by an ischemia vector, which flees from the ischemic zone towards the regions that normally repolarize. As the electrical defects of this vector are manifested during ventricular repolarization, modifications in the T wave will be observed. When ischemia is predominantly subepicardial, the ischemia vector, which runs away from the epicardium pointing towards the endocardium, will cause negative T waves of different morphology of that of normal waves, that is, pointed and with symmetrical branches.
In subendocardial ischemia, the epicardial region will be the first to recover, as it normally does. In these cases, the ischemia vector has the same orientation as the normal repolarization vectors, pointing from the endocardium towards the already repolarized epicardium. On the other hand, as the repolarization of the compromised endocardium takes place more slowly, the potential differences between the ischemic zone and the normal myocardium, by remaining present for a longer time, increase the amplitude and duration of the T waves, which are high, pointed and symmetrical.
In summary, it can be said that ventricular necrosis modifies the QRS complex, the lesion unbalances the ST segment and ischemia alters the T wave. The vectors of necrosis and ischemia, with almost parallel orientation, flee from the compromised regions, while the injury vector, opposite to the first two, points towards these regions.
Topographic diagnosis of myocardial infarction. The orientation of the vectors, representative of the electrical defects resulting from a myocardial infarction, allows the location of the compromised area to be determined with some precision. Although there are sometimes certain divergences between electrocardiographic deductions and post-mortem findings, in many other cases a satisfactory concordance is obtained between these elements, concordance that increases as more experiences and anatomoclinical studies become available (Figs. 11 -32 and 11-33).
Infarcts located in the anterior wall. They can be divided into:
1. Anteroseptal: It is generally seen in leads V1, V2, and V3.
2. Anterolateral: it manifests mainly in leads V4, V5, V6, DI and aVL.
3. Lateral high: only recorded in leads DI and aVL, and occasionally also in leads V2 and V3.
4. Anterior extensive: seen in leads V1 to V6.
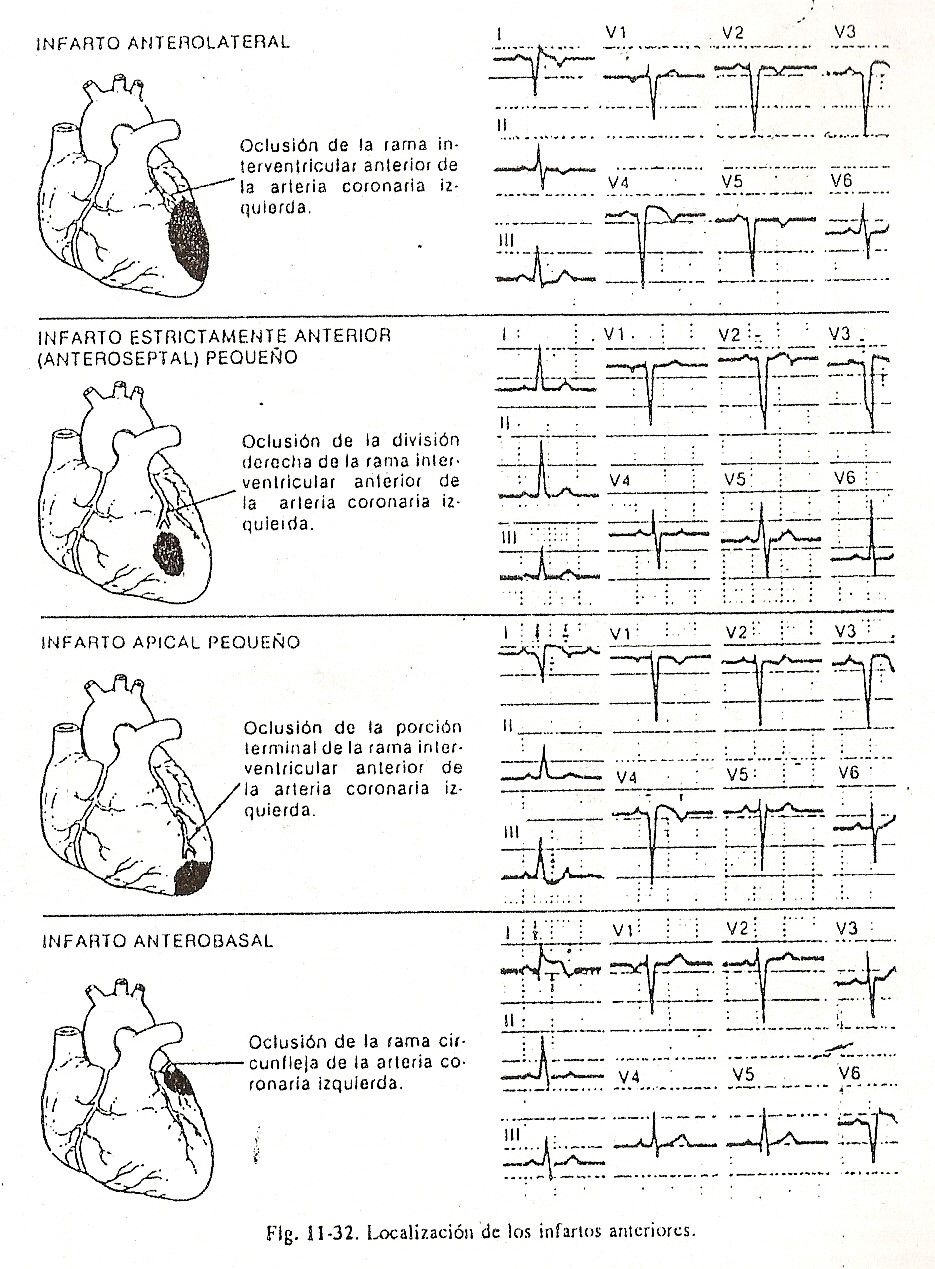 Infarcts located in the lower wall. They are as follows:
1. Inferior proper: seen in leads DII, DIII, and aVF.
2. Inferolateral: in leads DII, DIII, aVF, V5 and V6.
3. Inferoanteroseptal: in leads DII, DIII, aVF, V1 and V2.
Dorsal wall infarcts. They are divided into:
1. Bib only: corresponds to leads V7 and V8.
2. Inferodorsal: in leads DII, DIII, aVF, V5, V6, V7 and V8.
3. Laterodorsal: in leads DI, aVL, V5, V6, V7, and V8.
4. Inferolaterodorsal: DI, aVL, DII, DIII, aVF, V5 and V6.
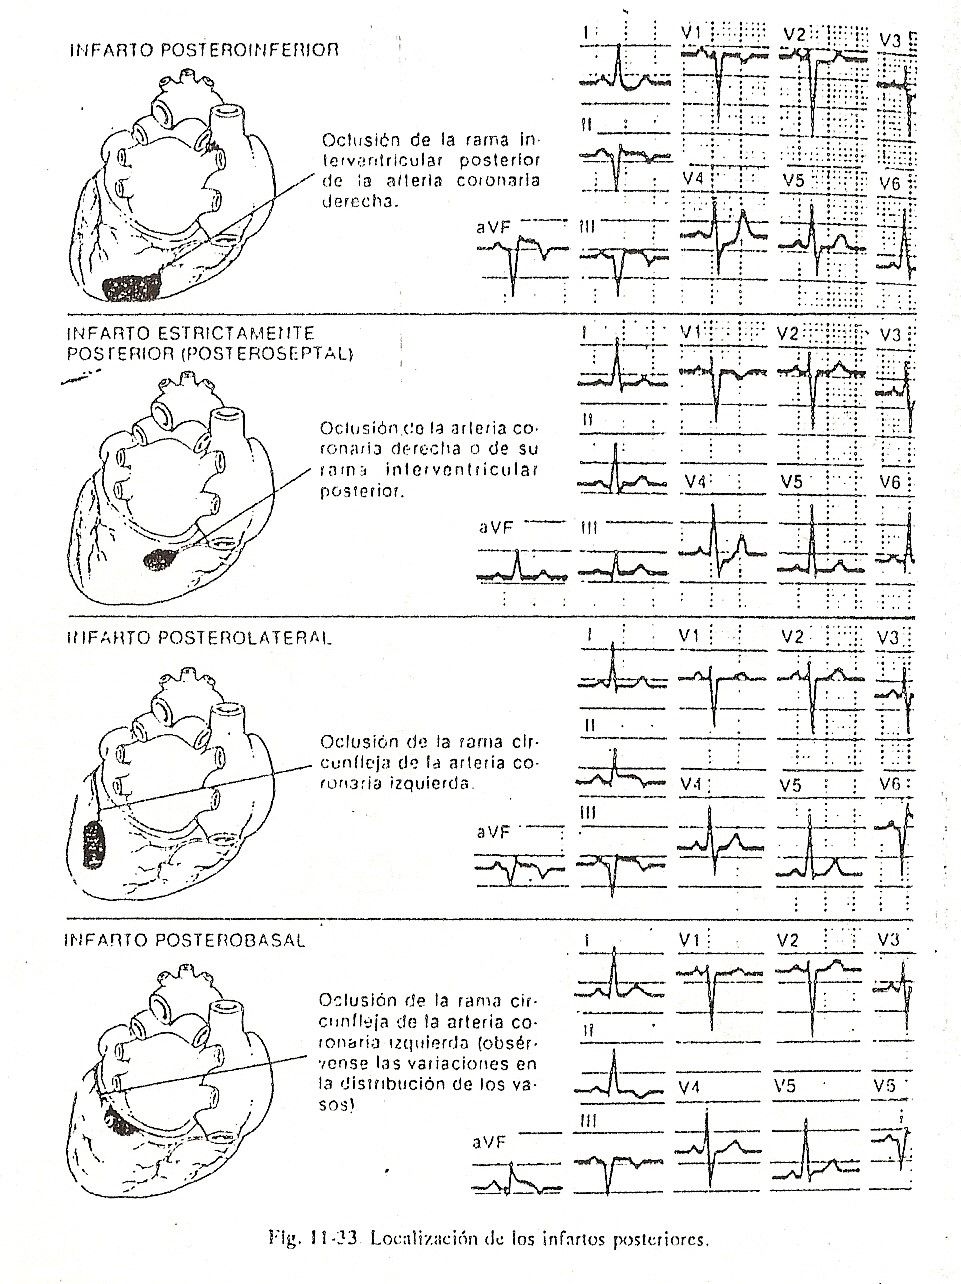 Ventricular free wall infarcts. They can be classified into:
1. Transmural infarction. The electrode oriented towards the electrically inactive zone registers complexes of the QS type, with a negative T wave, since the electrical forces that predominate during ventricular depolarization move away in the opposite direction.
2. Infarction located in the inner two thirds of the wall (electrical endocardium). This infarction does not alter the QRS complex, since the muscular area (external third) whose depolarization is responsible for recording is not affected. Infarction can be indirectly diagnosed by the effects of the lesion and subendocardial ischemia and the presence of a suggestive clinical picture.
3. Infarction located in the entire thickness of the electrical epicardium. The electrode will register QS or QR deflections depending on the influence that the potentials resulting from the depolarization of the neighboring portions may exert on it. It is inferred, therefore, that it is very difficult to differentiate between a transmural infarction and one located only in the subepicardial region.
4. Infarction located in the epicardium with the exception of a small area at the limit of the electrical endocardium. These infarcts are difficult to recognize by the electrocardiographic study, a difficulty that increases the larger the entire sub-picardial area, whose depolarization will still allow the recording of an R wave with a slightly decreased voltage. In this case, the suspicion of infarction is obtained indirectly by the appearance of signs of injury and subepicardial ischemia.
Evolutionary diagnosis of myocardial infarction. In the acute phase of myocardial infarction, there are slight signs of necrosis, that is, a Q wave with ST segments that speak of a very marked injury. Subsequently, the presence of the Q wave will increase, that is, the signs of necrosis, and the lesion ST segment will gradually descend and the negative T wave will appear, which translates the ischemia. As time goes by, the ST segment will normalize, the Q wave will continue to progress and the T wave will be negative or will continue to speak of ischemia. After 4 to 6 weeks, a Q wave will be seen with a normal ST and a negative T wave. In some cases, the ST segment can remain elevated for a period of time, sometimes up to years.
Subendocardial infarction. For many years, it was considered that subendocardial infarction was not as serious an accident as a transmural infarction. Recent studies have shown that the subendocardial layers are much more sensitive to ischemia. These infarcts are the result of a necrosis of this layer, which is particularly vulnerable when ischemia is prolonged. In many cases it has been observed that the subendocardial surface of an infarct is almost always larger than the subepicardial one, and on the other hand, these patients can present this subendocardial infarction as the first step of a major coronary accident.
Electrocardiographic recognition of this location is still controversial. The elements of judgment are the following:
1. Descent of point j recorded on the epicardium of the left ventricle or on the left precordials and on the inferior or lateral aspect.
2. Segment ST slightly convex upwards, a fact that should attract attention considering that it follows a point j lowered.
3. Mirror image at aVR and V1 level of the events discussed.
4. T wave with marked negativity at the level of the precordial V3 and V4.
On reflection, the electrocardiographic patterns listed together present a mirror or reciprocal image of a hyperacute infarction.
Infarction of the free wall of the right ventricle. For a long time, infarction of the free wall of the right ventricle was also considered an extremely rare event. Currently, with the advancement of diagnostic techniques, it has been possible to objectify a compromise of the right ventricle on numerous occasions, especially in those infarcts located on the lower face. Therefore, to deepen the study of these infarcts, we recommend obtaining leads V3R, V4R, and V5R, which are the same as those on the left side but transferred to the right hemithorax. Along with this, it is convenient to remember the clinical profile of these infarcts:
1. Signs of right ventricular failure with jugular engorgement, hepatomegaly, and tricuspid regurgitation.
2. Low systemic debit with hypotension, oliguria, mental confusion and coldness of the limbs.
I 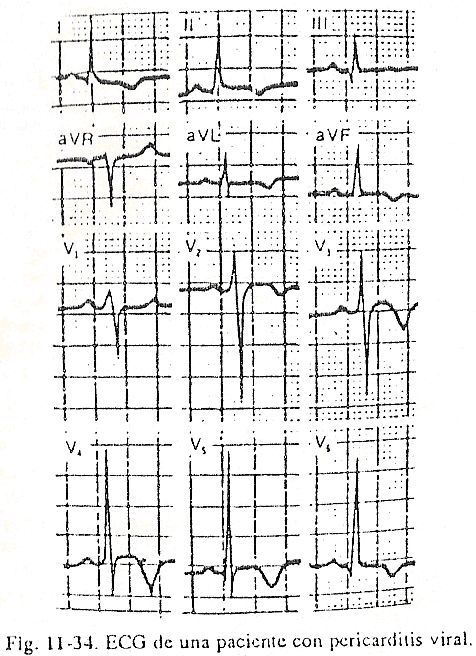 atrial nfarto. It has been proven that between 7% and 17% of acute myocardial infarctions are accompanied by atrial myocardial compromise, which may well go unnoticed if it is not thought about and is not investigated. The electrocardiographic signs that can help us in the diagnosis of atrial infarction are:
1. Up or down elevation of the PR segment, a sign that will have more value if it is of the same polarity as the P wave that precedes it, since it is normally opposed to the atrial repolarization wave.
2. Rectification between the junction of the P wave and the PR segment with loss at this level of the normal obtuse angle. Changes in the morphology of the P wave, which sometimes becomes peaked and sometimes takes the shape of the letter “M” or “W”, as well as the presence of atrial arrhythmias (eg, variable pacemakers or sinoatrial blocks in patients with acute ventricular myocardial infarction), should make us suspect the presence of an atrial infarction.
Other Electrocardiographic Findings in Coronary Artery Disease. On many occasions, the ECG is completely normal, and yet the patient may be a carrier of coronary artery disease. Thus, in coronary insufficiency, an upward concave ST segment and low-voltage T waves are common, occasionally splintered or negative in leads DI, aVL, V4, V5, and V6. Other times the morphological changes described are seen in almost all the usual leads and are called nonspecific repolarization disorders. Regarding atrial activation, there are usually electrocardiographic indications of intra-atrial stimulus conduction disorder, observing splintered or widened P waves, sometimes irregularities of the P waves, sinus arrhythmias, that in elderly patients can be suspected of coronary disease. The QRS complexes may also be altered with signs of left ventricular overload and a deviated cardiac electrical axis to the left. Most of the time, no increase in QRS voltage is observed, since diffuse myocardial fibrosis can prevent the increase in electrical potentials. It is common to record morphologies of incomplete or even complete left bundle branch block. The initial thickening of the ascending branch of R, with the absence of a Q wave in the left leads, may be related to septal fibrosis, and incomplete left branch block cannot always be invoked to explain these alterations. The QRS complexes may also be altered with signs of left ventricular overload and a deviated cardiac electrical axis to the left. Most of the time, no increase in QRS voltage is observed, since diffuse myocardial fibrosis can prevent the increase in electrical potentials. It is common to record morphologies of incomplete or even complete left bundle branch block. The initial thickening of the ascending branch of R, with the absence of a Q wave in the left leads, may be related to septal fibrosis, and incomplete left branch block cannot always be invoked to explain these alterations. The QRS complexes may also be altered with signs of left ventricular overload and a deviated cardiac electrical axis to the left. Most of the time, no increase in QRS voltage is observed, since diffuse myocardial fibrosis can prevent the increase in electrical potentials. It is common to record morphologies of incomplete or even complete left bundle branch block. The initial thickening of the ascending branch of R, with the absence of a Q wave in the left leads, may be related to septal fibrosis, and incomplete left branch block cannot always be invoked to explain these alterations. Most of the time, no increase in QRS voltage is observed, since diffuse myocardial fibrosis can prevent the increase in electrical potentials. It is common to record morphologies of incomplete or even complete left bundle branch block. The initial thickening of the ascending branch of R, with the absence of a Q wave in the left leads, may be related to septal fibrosis, and incomplete left branch block cannot always be invoked to explain these alterations. Most of the time, no increase in QRS voltage is observed, since diffuse myocardial fibrosis can prevent the increase in electrical potentials. It is common to record morphologies of incomplete or even complete left bundle branch block. The initial thickening of the ascending branch of R, with the absence of a Q wave in the left leads, may be related to septal fibrosis, and incomplete left branch block cannot always be invoked to explain these alterations.
The most frequent dysrhythmias are ventricular or supraventricular extrasystoles. As we have said previously, on the occasions when the electrocardiographic tracing is normal in patients with suspected coronary disease, other study methods should be used to deepen and give an accurate diagnosis of the patient's disease. Such studies may consist of ergometry or gamma camera examinations that are more sensitive and specific for diagnosing these pathologies.
Pericarditis
The subepicardial involvement of the ventricular myocardium that often occurs in pericardial affections, usually has an electrocardiographic expression.
In the initial stages of pericarditis, sinus tachycardia and ST segment elevation can be seen in leads DI, DII, DIII, aVF, and left precordial, and is occasionally found in V1. The behavior of the T wave is highly variable; ST segment alterations are more frequent and accentuated when the pericardial effusion is installed suddenly and under high pressure. Occasionally, when pericarditis is accompanied by a profuse effusion in the pericardial cavity, a fairly common finding is low-voltage complexes and electrocardiographic signs of electrical alternation (Fig. 11-34).